Page 388 - Hydrocarbon Exploration and Production Second Edition
P. 388

Risk Analysis                                                         375


                                             Spider Diagram
                                                80
                                                                            reserves
                                                                            capex
                                                60
                                                                            fixopex
                                                                            varopex
                                                40                          timing
                                                                            price
                                                20                          Spiders Web
                NPV (8%)  -50  -40  -30  -20  -10  -20 0  10   20     30    40     50
                                                 0


                                                -40
                                                -60
                                                -80

                                               -100
                                               -120
                                          % Change in Parameter
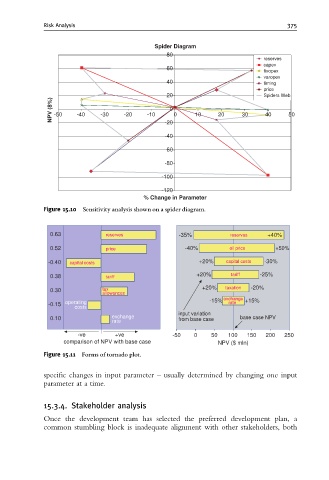
             Figure 15.10  Sensitivity analysis shown on a spider diagram.


               0.63            reserves             -35%          reserves   +40%

               0.52            price                  -40%        oil price    +50%
               -0.40  capital costs                       +20%   capital costs  -30%
               0.38            tariff                    +20%      tariff  -25%

               0.30           tax                         +20%   taxation  -20%
                              allowances
                                                                  rate
               -0.15  operating                              -15%  exchange  +15%
                      costs
                                                    input variation
               0.10              exchange           from base case   base case NPV
                                 rate
                       -ve        +ve             -50   0    50   100  150   200  250
                   comparison of NPV with base case            NPV ($ mln)
             Figure 15.11 Forms of tornado plot.


             specific changes in input parameter – usually determined by changing one input
             parameter at a time.


             15.3.4. Stakeholder analysis

             Once the development team has selected the preferred development plan, a
             common stumbling block is inadequate alignment with other stakeholders, both
   383   384   385   386   387   388   389   390   391   392   393