
Page 386 - Hydrocarbon Exploration and Production Second Edition
P. 386
Risk Analysis 373
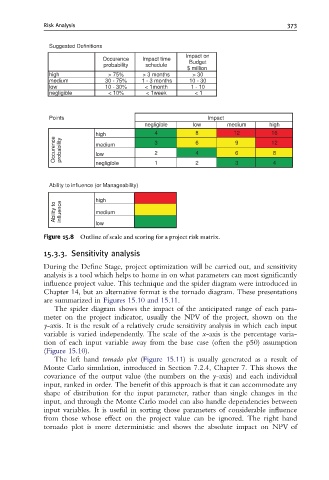
Suggested Definitions
Impact on
Occurence Impact time Budget
probability schedule
$ million
high > 75% > 3 months > 30
medium 30 - 75% 1 - 3 months 10 - 30
low 10 - 30% < 1month 1 - 10
negligible < 10% < 1week < 1
Points Impact
negligible low medium high
high 4 8 12 16
Occurence probability medium 3 2 1 6 4 2 9 6 3 12
8
low
4
negligible
Ability to influence (or Manageability)
high
Ability to influence medium
low
Figure 15.8 Outline of scale and scoring for a project risk matrix.
15.3.3. Sensitivity analysis
During the Define Stage, project optimization will be carried out, and sensitivity
analysis is a tool which helps to home in on what parameters can most significantly
influence project value. This technique and the spider diagram were introduced in
Chapter 14, but an alternative format is the tornado diagram. These presentations
are summarized in Figures 15.10 and 15.11.
The spider diagram shows the impact of the anticipated range of each para-
meter on the project indicator, usually the NPV of the project, shown on the
y-axis. It is the result of a relatively crude sensitivity analysis in which each input
variable is varied independently. The scale of the x-axis is the percentage varia-
tion of each input variable away from the base case (often the p50) assumption
(Figure 15.10).
The left hand tornado plot (Figure 15.11) is usually generated as a result of
Monte Carlo simulation, introduced in Section 7.2.4, Chapter 7. This shows the
covariance of the output value (the numbers on the y-axis) and each individual
input, ranked in order. The benefit of this approach is that it can accommodate any
shape of distribution for the input parameter, rather than single changes in the
input, and through the Monte Carlo model can also handle dependencies between
input variables. It is useful in sorting those parameters of considerable influence
from those whose effect on the project value can be ignored. The right hand
tornado plot is more deterministic and shows the absolute impact on NPV of