
Page 389 - Hydrocarbon Exploration and Production Second Edition
P. 389
376 Risk Analysis for Major Capital Investments in Projects
within and outside the company. Stakeholders may include
company management, employees and shareholders
government and regulatory bodies (national and local)
partners
neighbours
NGOs, for example environmental, human rights
financial institutions (e.g. World Bank)
suppliers and contractors
competitors.
Primary stakeholders are those who are directly affected by a project, while
secondary stakeholders are those not directly affected by the project, but who may
have an influence, interest or expertise to offer. Identification and classification of
the stakeholders can help to prioritise their involvement and identify opportunities
for potential collaboration or partnership.
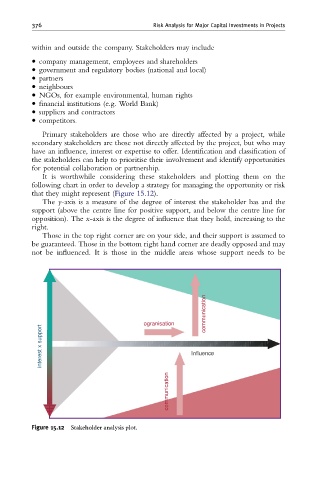
It is worthwhile considering these stakeholders and plotting them on the
following chart in order to develop a strategy for managing the opportunity or risk
that they might represent (Figure 15.12).
The y-axis is a measure of the degree of interest the stakeholder has and the
support (above the centre line for positive support, and below the centre line for
opposition). The x-axis is the degree of influence that they hold, increasing to the
right.
Those in the top right corner are on your side, and their support is assumed to
be guaranteed. Those in the bottom right hand corner are deadly opposed and may
not be influenced. It is those in the middle areas whose support needs to be
communication
ogranisation
support
x
interest Influence
communication
Figure 15.12 Stakeholder analysis plot.