
Page 100 - Hydrogeology Principles and Practice
P. 100
HYDC03 12/5/05 5:36 PM Page 83
Chemical hydrogeology 83
An ionic balance error of less than 5% should be achiev-
able with modern analytical equipment and certainly
less than 10%. Larger errors are unacceptable and
suggest that one or more analyses are in error.
Various methods have been developed for the
visual inspection of hydrochemical data in order to
look for discernible patterns and trends. By grouping
chemical analyses it becomes possible to identify
hydrochemical facies and begin to understand the
hydrogeological processes that influence the ground-
water chemistry. The simplest methods include plot-
ting distribution diagrams, bar charts, pie charts,
radial diagrams and pattern diagrams (as presented
by Stiff 1951). Although these are easy to construct,
they are not convenient for graphical presentation of
large numbers of analyses and for this reason other
techniques are used including Schoeller (named after
Schoeller 1962), trilinear (Piper 1944) and Durov
(Durov 1948) diagrams.
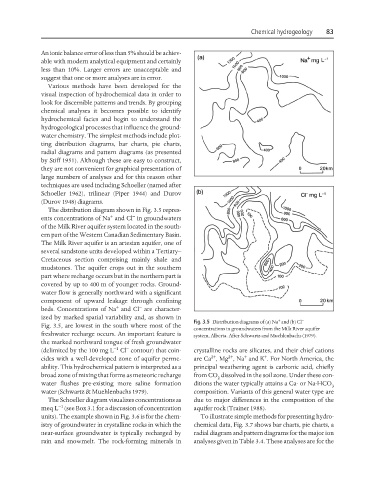
The distribution diagram shown in Fig. 3.5 repres-
+ −
ents concentrations of Na and Cl in groundwaters
of the Milk River aquifer system located in the south-
ern part of the Western Canadian Sedimentary Basin.
The Milk River aquifer is an artesian aquifer, one of
several sandstone units developed within a Tertiary–
Cretaceous section comprising mainly shale and
mudstones. The aquifer crops out in the southern
part where recharge occurs but in the northern part is
covered by up to 400 m of younger rocks. Ground-
water flow is generally northward with a significant
component of upward leakage through confining
+ −
beds. Concentrations of Na and Cl are character-
ized by marked spatial variability and, as shown in + −
Fig. 3.5 Distribution diagrams of (a) Na and (b) Cl
Fig. 3.5, are lowest in the south where most of the
concentrations in groundwaters from the Milk River aquifer
freshwater recharge occurs. An important feature is system, Alberta. After Schwartz and Muehlenbachs (1979).
the marked northward tongue of fresh groundwater
−
−1
(delimited by the 100 mg L Cl contour) that coin- crystalline rocks are silicates, and their chief cations
2+ 2+ + +
cides with a well-developed zone of aquifer perme- are Ca , Mg , Na and K . For North America, the
ability. This hydrochemical pattern is interpreted as a principal weathering agent is carbonic acid, chiefly
broad zone of mixing that forms as meteoric recharge from CO dissolved in the soil zone. Under these con-
2
water flushes pre-existing more saline formation ditions the water typically attains a Ca- or Na-HCO
3
water (Schwartz & Muehlenbachs 1979). composition. Variants of this general water type are
The Schoeller diagram visualizes concentrations as due to major differences in the composition of the
−1
meq L (see Box 3.1 for a discussion of concentration aquifer rock (Trainer 1988).
units). The example shown in Fig. 3.6 is for the chem- To illustrate simple methods for presenting hydro-
istry of groundwater in crystalline rocks in which the chemical data, Fig. 3.7 shows bar charts, pie charts, a
near-surface groundwater is typically recharged by radial diagram and pattern diagrams for the major ion
rain and snowmelt. The rock-forming minerals in analyses given in Table 3.4. These analyses are for the