
Page 102 - Hydrogeology Principles and Practice
P. 102
HYDC03 12/5/05 5:36 PM Page 85
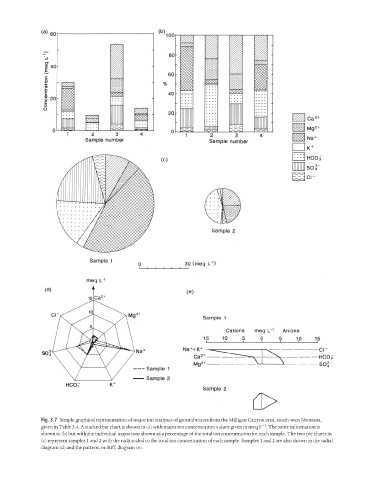
Fig. 3.7 Simple graphical representation of major ion analyses of groundwaters from the Milligan Canyon area, south-west Montana,
−1
given in Table 3.4. A stacked bar chart is shown in (a) with major ion concentration values given in meq L . The same information is
shown in (b) but with the individual major ions shown as a percentage of the total ion concentration for each sample. The two pie charts in
(c) represent samples 1 and 2 with the radii scaled to the total ion concentration of each sample. Samples 1 and 2 are also shown in the radial
diagram (d) and the pattern, or Stiff, diagram (e).