Page 106 - Hydrogeology Principles and Practice
P. 106

HYDC03  12/5/05  5:36 PM  Page 89


                                                                                Chemical hydrogeology  89


                                                               3.6.2 Energetic approach to chemical equilibrium

                                                               In this approach to chemical equilibrium, the most
                                                               stable composition of a mixture of reactants is the
                                                               composition having the lowest energy. This more
                                                               rigorous thermodynamic treatment, compared with
                                                               the kinetic approach, involves enthalpy, the heat
                                                               content, H, at constant pressure, and entropy, S, a
                                                               measure of the disorder of a system. The change in
                                                                                         −1
                                                               enthalpy (∆H, measured in J mol ) in a reaction is a
                                                               direct measure of the energy emitted or absorbed.
                                                               The change in entropy in most reactions (∆S, meas-
                                                                          −1
                                                                             −1
                                                               ured in J mol K ) proceeds to increase disorder,
                                                               for example by splitting a compound into its con-
                                                               stituent ions. For a reversible process, the change in
                                                               entropy is equal to the amount of heat taken up by a
                                                               reaction divided by the absolute temperature, T, at
                                                               which the heat is absorbed.
                                                                 The total energy released, or the energy change in
                                                               going from reactants to products, is termed the Gibbs
                                                                                            −1
                                                               free energy, G (measured in kJ mol ). If energy is
                                                               released, in which case the products have lower free
                                                               energy than the reactants, G is considered negative.
                                                               The change in Gibbs free energy is defined as:

                                                               ∆G =∆H − T∆S                        eq. 3.8

                                                               By convention, elements in their standard state (25°C
                                                               and 1 atmosphere pressure) are assigned enthalpy and
                                                               free energy values of zero. Standard state thermodyn-
                                                                                              o
                                                               amic data, indicated by the superscript  , and tabul-
                                                               ated as values of standard free energies, enthalpies
                                                               and entropies, are given in most geochemistry and
                                                               aqueous chemistry textbooks, for example Krauskopf
                                                               and Bird (1995) and Stumm and Morgan (1981).
                                                                         o
                                                               Values of ∆G for different reactions can be calculated
                                                               by simple arithmetic combination of the tabulated
                                                                                               o
                                                               values. Any reaction with a negative ∆G value will,
                                                               in theory, proceed spontaneously (the chemical
                                                               equivalent of water flowing down a hydraulic gradi-
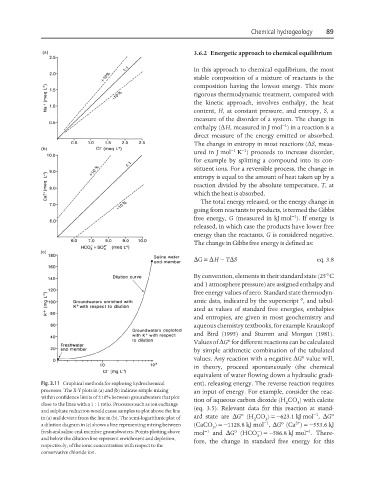
                   Fig. 3.11 Graphical methods for exploring hydrochemical  ent), releasing energy. The reverse reaction requires
                   processes. The X-Y plots in (a) and (b) indicate simple mixing  an input of energy. For example, consider the reac-
                   within confidence limits of ±10% between groundwaters that plot
                                                               tion of aqueous carbon dioxide (H CO ) with calcite
                   close to the lines with a 1 : 1 ratio. Processes such as ion exchange  2  3
                                                               (eq. 3.5). Relevant data for this reaction at stand-
                   and sulphate reduction would cause samples to plot above the line
                                                                             o
                                                                                                  −1
                   in (a) and deviate from the line in (b). The semi-logarithmic plot of  ard state are  ∆G (H CO ) =−623.1 kJ mol ,  ∆G o
                                                                                 2
                                                                                    3
                                                                                             2+
                                                                                    −1
                                                                                         o
                   a dilution diagram in (c) shows a line representing mixing between  (CaCO ) =−1128.8 kJ mol , ∆G (Ca ) =−553.6 kJ
                                                                     3
                                                                                  −
                                                                                                −1
                   fresh and saline end-member groundwaters. Points plotting above  mol −1  and  ∆G (HCO ) =−586.8 kJ mol . There-
                                                                           o
                   and below the dilution line represent enrichment and depletion,  3
                                                               fore, the change in standard free energy for this
                   respectively, of the ionic concentration with respect to the
                   conservative chloride ion.
   101   102   103   104   105   106   107   108   109   110   111