
Page 103 - Hydrogeology Principles and Practice
P. 103
HYDC03 12/5/05 5:36 PM Page 86
86 Chapter Three
Table 3.4 Major ion analyses of four groundwater samples from the Milligan Canyon area, south-west Montana, used to plot Figs 3.7–3.9.
Data from Krothe and Bergeron (1981).
Water type Sample number Ca 2+ Mg 2+ Na + K + HCO − 3 SO 4 2− Cl −
−1
Ion concentration (mg L )
Ca-HCO 3 2 47 25.2 10 3.1 251 29 7
Ca-SO 4 3 426 103 56 5.4 328 1114 143
Na-HCO 3 4 73 6.4 83 4.5 236 158 17
Na-SO 4 1 49 13.7 312 29.2 286 566 43
−1
Ion concentration(meq L )
Ca-HCO 3 2 2.35 2.10 0.43 0.08 4.11 0.30 0.20
Ca-SO 4 3 21.30 8.58 2.43 0.14 5.38 11.60 4.09
Na-HCO 3 4 3.65 0.53 3.61 0.12 3.87 1.65 0.49
Na-SO 4 1 2.45 1.14 13.57 0.75 4.69 5.90 1.23
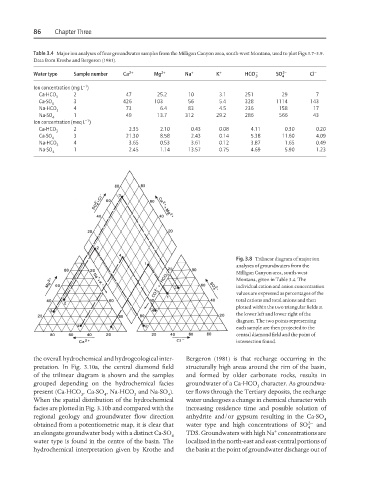
Fig. 3.8 Trilinear diagram of major ion
analyses of groundwaters from the
Milligan Canyon area, south-west
Montana, given in Table 3.4. The
individual cation and anion concentration
values are expressed as percentages of the
total cations and total anions and then
plotted within the two triangular fields at
the lower left and lower right of the
diagram. The two points representing
each sample are then projected to the
central diamond field and the point of
intersection found.
the overall hydrochemical and hydrogeological inter- Bergeron (1981) is that recharge occurring in the
pretation. In Fig. 3.10a, the central diamond field structurally high areas around the rim of the basin,
of the trilinear diagram is shown and the samples and formed by older carbonate rocks, results in
grouped depending on the hydrochemical facies groundwater of a Ca-HCO character. As groundwa-
3
present (Ca-HCO , Ca-SO , Na-HCO and Na-SO ). ter flows through the Tertiary deposits, the recharge
3 4 3 4
When the spatial distribution of the hydrochemical water undergoes a change in chemical character with
facies are plotted in Fig. 3.10b and compared with the increasing residence time and possible solution of
regional geology and groundwater flow direction anhydrite and/or gypsum resulting in the Ca-SO 4
2−
obtained from a potentiometric map, it is clear that water type and high concentrations of SO 4 and
+
an elongate groundwater body with a distinct Ca-SO TDS. Groundwaters with high Na concentrations are
4
water type is found in the centre of the basin. The localized in the north-east and east-central portions of
hydrochemical interpretation given by Krothe and the basin at the point of groundwater discharge out of