Page 101 - Hydrogeology Principles and Practice
P. 101

HYDC03  12/5/05  5:36 PM  Page 84


                 84    Chapter Three


                                                             Milligan Canyon area, south-west Montana, in the
                                                             eastern region of the Northern Rocky Mountain
                                                             Province. The area is a broad synclinal basin with
                                                             folded carbonate rocks of Palaeozoic and Mesozoic
                                                             age on the southern rim, and volcanic breccia and
                                                             andesitic lava overlying older, deformed rocks on the
                                                             northern rim. The basin is infilled with unconsolid-
                                                             ated alluvial and aeolian deposits and Tertiary sedi-
                                                             ments of siltstones, limestones and sandstones that
                                                             contain deposits of gypsum (CaSO ⋅2H O) and anhy-
                                                                                        4  2
                                                             drite (CaSO ). A number of Upper Cretaceous and
                                                                       4
                                                             early Tertiary igneous intrusives are also present.
                                                             Groundwater flow is predominantly from west to
                                                             east but with a contribution of upward groundwater
                                                             flow from the Madison limestone aquifer underlying
                                                             the basin. High groundwater yields are obtained
                                                             from the Tertiary basin.
                                                               The same major ion analyses for the Milligan
                                                             Canyon area are also presented as trilinear and Durov
                                                             diagrams in Figs 3.8 and 3.9. With these methods of
                                                             graphical presentation, the concentrations of indivi-
                                                             dual samples are plotted as percentages of the total
                                                             cation and/or anion concentrations, such that sam-
                                                             ples with very different total ionic concentrations can
                                                             occupy the same position in the diagrams. Also, with
                                                             the trilinear diagram (Fig. 3.8), samples that plot on
                                                             a straight line within the central diamond field
                                                             represent mixing of groundwaters between two end-
                                                             member solutions, for example freshwater and saline
                                                             water. Further hydrochemical interpretations can be
                                                             obtained from the Durov diagram (Fig. 3.9). Lines
                                                             from the central square field can be extended to the
                                                             adjacent scaled rectangles to allow for representation
                                                             in terms of two further parameters.
                                                               The next step in the hydrochemical interpretation
                                                             after plotting the chemical data in a variety of ways is
                                                             to identify the hydrochemical facies present and to
                                                             prepare maps and cross-sections to show the regional
                                                             distribution of water types. In the example of ground-
                                                             waters in the Milligan Canyon area, Fig. 3.10 shows


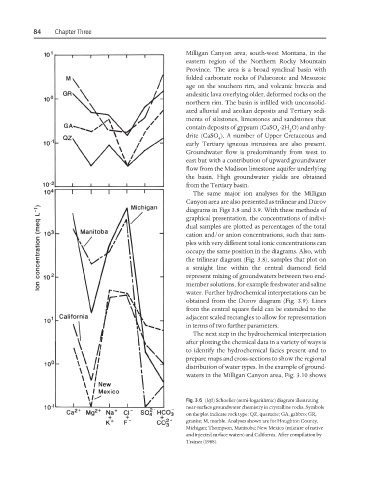
                                                             Fig. 3.6 (left) Schoeller (semi-logarithmic) diagram illustrating
                                                             near-surface groundwater chemistry in crystalline rocks. Symbols
                                                             on the plot indicate rock type: QZ, quartzite; GA, gabbro; GR,
                                                             granite; M, marble. Analyses shown are for Houghton County,
                                                             Michigan; Thompson, Manitoba; New Mexico (mixture of native
                                                             and injected surface waters) and California. After compilation by
                                                             Trainer (1988).
   96   97   98   99   100   101   102   103   104   105   106