
Page 104 - Hydrogeology Principles and Practice
P. 104
HYDC03 12/5/05 5:36 PM Page 87
Chemical hydrogeology 87
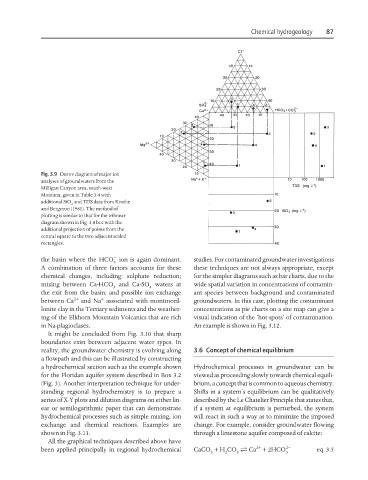
Fig. 3.9 Durov diagram of major ion
analyses of groundwaters from the
Milligan Canyon area, south-west
Montana, given in Table 3.4 with
additional SiO and TDS data from Krothe
2
and Bergeron (1981). The method of
plotting is similar to that for the trilinear
diagram shown in Fig. 3.8 but with the
additional projection of points from the
central square to the two adjacent scaled
rectangles.
−
the basin where the HCO ion is again dominant. studies. For contaminated groundwater investigations
3
A combination of three factors accounts for these these techniques are not always appropriate, except
chemical changes, including: sulphate reduction; for the simpler diagrams such as bar charts, due to the
mixing between Ca-HCO and Ca-SO waters at wide spatial variation in concentrations of contamin-
3 4
the exit from the basin; and possible ion exchange ant species between background and contaminated
2+ +
between Ca and Na associated with montmoril- groundwaters. In this case, plotting the contaminant
lonite clay in the Tertiary sediments and the weather- concentrations as pie charts on a site map can give a
ing of the Elkhorn Mountain Volcanics that are rich visual indication of the ‘hot spots’ of contamination.
in Na-plagioclases. An example is shown in Fig. 3.12.
It might be concluded from Fig. 3.10 that sharp
boundaries exist between adjacent water types. In
reality, the groundwater chemistry is evolving along 3.6 Concept of chemical equilibrium
a flowpath and this can be illustrated by constructing
a hydrochemical section such as the example shown Hydrochemical processes in groundwater can be
for the Floridan aquifer system described in Box 3.2 viewed as proceeding slowly towards chemical equili-
(Fig. 3). Another interpretation technique for under- brium, a concept that is common to aqueous chemistry.
standing regional hydrochemistry is to prepare a Shifts in a system’s equilibrium can be qualitatively
series of X-Y plots and dilution diagrams on either lin- described by the Le Chatelier Principle that states that,
ear or semilogarithmic paper that can demonstrate if a system at equilibrium is perturbed, the system
hydrochemical processes such as simple mixing, ion will react in such a way as to minimize the imposed
exchange and chemical reactions. Examples are change. For example, consider groundwater flowing
shown in Fig. 3.11. through a limestone aquifer composed of calcite:
All the graphical techniques described above have
2+ 2−
been applied principally in regional hydrochemical CaCO + H CO j Ca + 2HCO eq. 3.5
3 2 3 3