Page 117 - Hydrogeology Principles and Practice
P. 117

HYDC03  12/5/05  5:36 PM  Page 100


                 100    Chapter Three


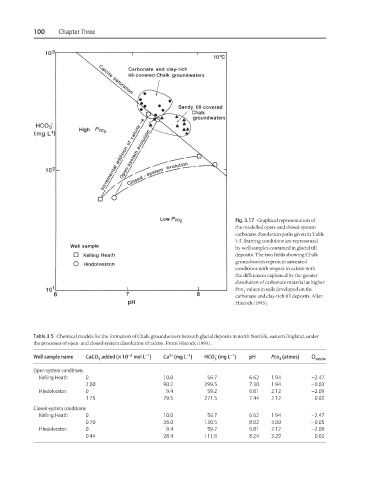
                                                                           Fig. 3.17 Graphical representation of
                                                                           the modelled open- and closed-system
                                                                           carbonate dissolution paths given in Table
                                                                           3.5. Starting conditions are represented
                                                                           by well samples contained in glacial till
                                                                           deposits. The two fields showing Chalk
                                                                           groundwaters represent saturated
                                                                           conditions with respect to calcite with
                                                                           the differences explained by the greater
                                                                           dissolution of carbonate material at higher
                                                                           Pco values in soils developed on the
                                                                              2
                                                                           carbonate and clay-rich till deposits. After
                                                                           Hiscock (1993).


                 Table 3.5 Chemical models for the formation of Chalk groundwaters beneath glacial deposits in north Norfolk, eastern England, under
                 the processes of open- and closed-system dissolution of calcite. From Hiscock (1993).
                                                                      −
                                                        2+
                                         ×
                                                                          −1
                                            −3
                                                             −1
                                                 −1
                 Well sample name  CaCO added (× 10 mol L )  Ca (mg L )  HCO (mg L )  pH  Pco (atmos)  X calcite
                                                                                        2
                                                                     3
                                    3
                 Open-system conditions
                  Kelling Heath  0                    10.0         56.7        6.62   1.94        −2.47
                                2.00                   90.2       299.5        7.30   1.94        −0.03
                  Hindolveston  0                      9.4         59.2        6.81   2.12        −2.09
                                1.75                   79.5       271.5         7.44  2.12         0.02
                 Closed-system conditions
                  Kelling Heath  0                    10.0         56.7        6.62   1.94        −2.47
                                0.70                   36.0       130.5        8.02   3.00        −0.05
                  Hindolveston  0                      9.4         59.2        6.81   2.12        −2.09
                                0.44                   28.4       111.6        8.24   3.29         0.02
   112   113   114   115   116   117   118   119   120   121   122