
Page 183 - Hydrogeology Principles and Practice
P. 183
HYDC05 12/5/05 5:35 PM Page 166
166 Chapter Five
The stream discharge is given by:
=
Q cv eq. 5.17
A
As with the steady-state method, the slug injection
method is based on the assumptions of complete
mixing in the stream cross-section, no tracer losses
and steady, uniform discharge.
5.6.3 Ultrasonic, electromagnetic and
integrating float methods
These three methods rely on the velocity–area mea-
surement approach, but permit automated monitor-
ing. Ultrasonic gauging uses pulses of high-frequency
ultrasound which are transmitted from both banks
at an angle of 45º to the flow, one upstream and one
downstream. The difference in time taken for the
sound waves to travel in either direction and be
received by transducers is proportional to the average
velocity of flow across the stream. Sampling can be
at one or more depths but measurements can be
affected by suspended sediment and other matter.
The technique does not obstruct navigation, with the
measurement section usually smoothed and lined to
create a stable, rectangular cross-section.
Electromagnetic gauging depends on an electric
cable buried in the stream bed. An applied electric
current creates an electromotive force (emf ) in the
above-flowing water which is proportional to the
average velocity in the cross-section as measured
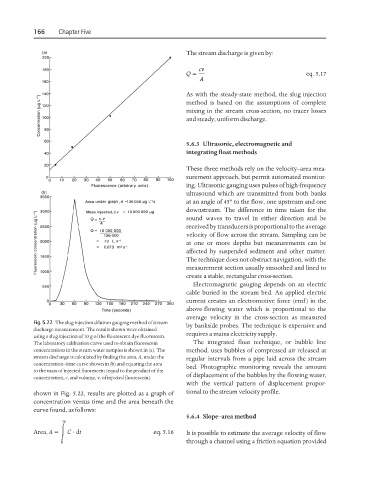
Fig. 5.22 The slug injection dilution gauging method of stream
by bankside probes. The technique is expensive and
discharge measurement. The results shown were obtained
requires a mains electricity supply.
using a slug injection of 10 g of the fluorescent dye fluorescein.
The laboratory calibration curve used to obtain fluorescein The integrated float technique, or bubble line
concentrations in the steam water samples is shown in (a). The method, uses bubbles of compressed air released at
stream discharge is calculated by finding the area, A, under the regular intervals from a pipe laid across the stream
concentration–time curve shown in (b) and equating the area
bed. Photographic monitoring reveals the amount
to the mass of injected fluorescein (equal to the product of the
of displacement of the bubbles by the flowing water,
concentration, c, and volume, v, of injected fluorescein).
with the vertical pattern of displacement propor-
shown in Fig. 5.22, results are plotted as a graph of tional to the stream velocity profile.
concentration versus time and the area beneath the
curve found, as follows:
5.6.4 Slope–area method
∞
Area, A = C ·dt eq. 5.16 It is possible to estimate the average velocity of flow
0 through a channel using a friction equation provided