
Page 187 - Hydrogeology Principles and Practice
P. 187
HYDC05 12/5/05 5:35 PM Page 170
170 Chapter Five
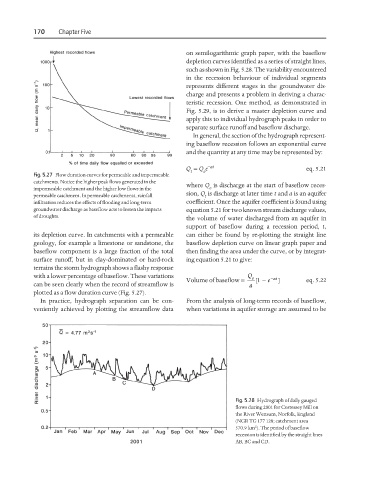
on semilogarithmic graph paper, with the baseflow
depletion curves identified as a series of straight lines,
such as shown in Fig. 5.28. The variability encountered
in the recession behaviour of individual segments
represents different stages in the groundwater dis-
charge and presents a problem in deriving a charac-
teristic recession. One method, as demonstrated in
Fig. 5.29, is to derive a master depletion curve and
apply this to individual hydrograph peaks in order to
separate surface runoff and baseflow discharge.
In general, the section of the hydrograph represent-
ing baseflow recession follows an exponential curve
and the quantity at any time may be represented by:
Q = Q e −at eq. 5.21
t
o
Fig. 5.27 Flow duration curves for permeable and impermeable
catchments. Notice the higher peak flows generated in the
where Q is discharge at the start of baseflow reces-
impermeable catchment and the higher low flows in the o
sion, Q is discharge at later time t and a is an aquifer
permeable catchment. In permeable catchments, rainfall t
infiltration reduces the effects of flooding and long-term coefficient. Once the aquifer coefficient is found using
groundwater discharge as baseflow acts to lessen the impacts equation 5.21 for two known stream discharge values,
of droughts.
the volume of water discharged from an aquifer in
support of baseflow during a recession period, t,
its depletion curve. In catchments with a permeable can either be found by re-plotting the straight line
geology, for example a limestone or sandstone, the baseflow depletion curve on linear graph paper and
baseflow component is a large fraction of the total then finding the area under the curve, or by integrat-
surface runoff, but in clay-dominated or hard-rock ing equation 5.21 to give:
terrains the storm hydrograph shows a flashy response
with a lower percentage of baseflow. These variations Volume of baseflow = Q o [ e − at ] eq. 5.22
−
1
can be seen clearly when the record of streamflow is a
plotted as a flow duration curve (Fig. 5.27).
In practice, hydrograph separation can be con- From the analysis of long-term records of baseflow,
veniently achieved by plotting the streamflow data when variations in aquifer storage are assumed to be
Fig. 5.28 Hydrograph of daily gauged
flows during 2001 for Costessey Mill on
the River Wensum, Norfolk, England
(NGR TG 177 128; catchment area
2
570.9 km ). The period of baseflow
recession is identified by the straight lines
AB, BC and CD.