
Page 190 - Hydrogeology Principles and Practice
P. 190
HYDC05 12/5/05 5:35 PM Page 173
Groundwater investigation techniques 173
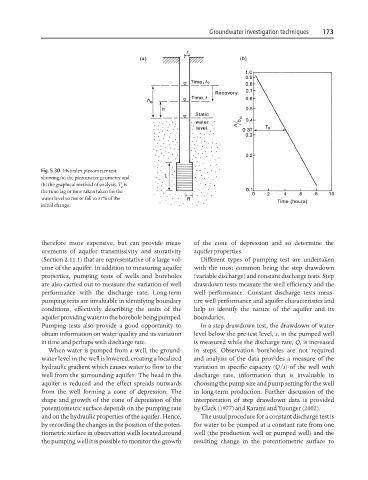
Fig. 5.30 Hvorslev piezometer test
showing (a) the piezometer geometry and
(b) the graphical method of analysis. T is
o
the time lag or time taken taken for the
water level to rise or fall to 37% of the
initial change.
therefore more expensive, but can provide meas- of the cone of depression and so determine the
urements of aquifer transmissivity and storativity aquifer properties.
(Section 2.11.1) that are representative of a large vol- Different types of pumping test are undertaken
ume of the aquifer. In addition to measuring aquifer with the most common being the step drawdown
properties, pumping tests of wells and boreholes (variable discharge) and constant discharge tests. Step
are also carried out to measure the variation of well drawdown tests measure the well efficiency and the
performance with the discharge rate. Long-term well performance. Constant discharge tests meas-
pumping tests are invaluable in identifying boundary ure well performance and aquifer characteristics and
conditions, effectively describing the units of the help to identify the nature of the aquifer and its
aquifer providing water to the borehole being pumped. boundaries.
Pumping tests also provide a good opportunity to In a step drawdown test, the drawdown of water
obtain information on water quality and its variation level below the pre-test level, s, in the pumped well
in time and perhaps with discharge rate. is measured while the discharge rate, Q, is increased
When water is pumped from a well, the ground- in steps. Observation boreholes are not required
water level in the well is lowered, creating a localized and analysis of the data provides a measure of the
hydraulic gradient which causes water to flow to the variation in specific capacity (Q/s) of the well with
well from the surrounding aquifer. The head in the discharge rate, information that is invaluable in
aquifer is reduced and the effect spreads outwards choosing the pump size and pump setting for the well
from the well forming a cone of depression. The in long-term production. Further discussion of the
shape and growth of the cone of depression of the interpretation of step drawdown data is provided
potentiometric surface depends on the pumping rate by Clark (1977) and Karami and Younger (2002).
and on the hydraulic properties of the aquifer. Hence, The usual procedure for a constant discharge test is
by recording the changes in the position of the poten- for water to be pumped at a constant rate from one
tiometric surface in observation wells located around well (the production well or pumped well) and the
the pumping well it is possible to monitor the growth resulting change in the potentiometric surface to