
Page 195 - Hydrogeology Principles and Practice
P. 195
HYDC05 12/5/05 5:35 PM Page 178
178 Chapter Five
BO X
Interpretation of a constant discharge pumping test and recovery test
5.2
As an example of the interpretation of pumping test data, Table 1 borehole located at a distance of 376 m. To obtain representative
gives the results of a constant discharge pumping test for a values of transmissivity and storativity, Fig. 2 shows the recorded
confined Chalk borehole site at Woolhampton in the south of values of drawdown, s, and time, t, plotted on log-log paper of the
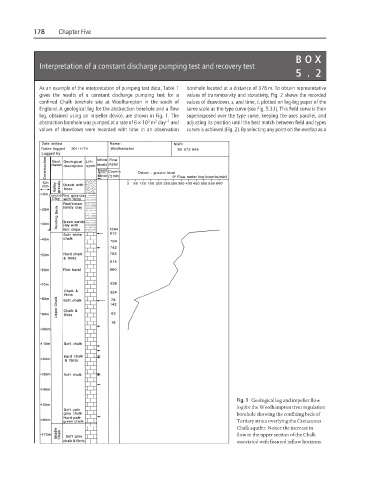
England. A geological log for the abstraction borehole and a flow same scale as the type curve (see Fig. 5.33). This field curve is then
log, obtained using an impeller device, are shown in Fig. 1. The superimposed over the type curve, keeping the axes parallel, and
−1
3
3
abstraction borehole was pumped at a rate of 6 × 10 m day and adjusting its position until the best match between field and types
values of drawdown were recorded with time in an observation curves is achieved (Fig. 2). By selecting any point on the overlap as a
Fig. 1 Geological log and impeller flow
log for the Woolhampton river regulation
borehole showing the confining beds of
Tertiary strata overlying the Cretaceous
Chalk aquifer. Notice the increase in
flow in the upper section of the Chalk
associated with fissured inflow horizons.