
Page 197 - Hydrogeology Principles and Practice
P. 197
HYDC05 12/5/05 5:35 PM Page 180
180 Chapter Five
BO X
Continued
5.2
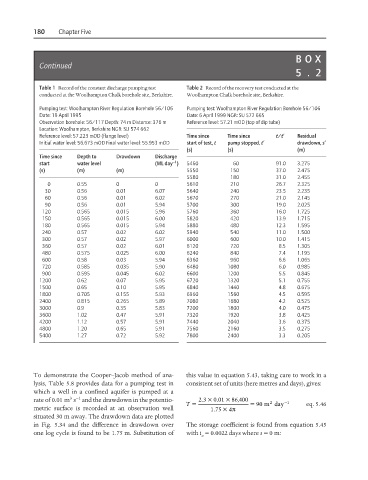
Table 1 Record of the constant discharge pumping test Table 2 Record of the recovery test conducted at the
conducted at the Woolhampton Chalk borehole site, Berkshire. Woolhampton Chalk borehole site, Berkshire.
Pumping test: Woolhampton River Regulation Borehole 56/106 Pumping test: Woolhampton River Regulation Borehole 56/106
Date: 19 April 1995 Date: 6 April 1999 NGR: SU 572 665
Observation borehole: 56/117 Depth: 74 m Distance: 376 m Reference level: 57.21 mOD (top of dip tube)
Location: Woolhampton, Berkshire NGR: SU 574 662
Reference level: 57.223 mOD (flange level) Time since Time since t/t′ Residual
Initial water level: 56.673 mOD Final water level: 55.953 mOD start of test, t pump stopped, t′ drawdown, s′
(s) (s) (m)
Time since Depth to Drawdown Discharge
−1
start water level (ML day ) 5460 60 91.0 3.275
(s) (m) (m) 5550 150 37.0 2.475
5580 180 31.0 2.455
0 0.55 0 0 5610 210 26.7 2.325
30 0.56 0.01 6.07 5640 240 23.5 2.235
60 0.56 0.01 6.02 5670 270 21.0 2.145
90 0.56 0.01 5.94 5700 300 19.0 2.025
120 0.565 0.015 5.96 5760 360 16.0 1.725
150 0.565 0.015 6.00 5820 420 13.9 1.715
180 0.565 0.015 5.94 5880 480 12.3 1.595
240 0.57 0.02 6.02 5940 540 11.0 1.500
300 0.57 0.02 5.97 6000 600 10.0 1.415
360 0.57 0.02 6.01 6120 720 8.5 1.305
480 0.575 0.025 6.00 6240 840 7.4 1.195
600 0.58 0.03 5.94 6360 960 6.6 1.065
720 0.585 0.035 5.90 6480 1080 6.0 0.985
900 0.595 0.045 6.02 6600 1200 5.5 0.845
1200 0.62 0.07 5.95 6720 1320 5.1 0.755
1500 0.65 0.10 5.95 6840 1440 4.8 0.675
1800 0.705 0.155 5.93 6960 1560 4.5 0.595
2400 0.815 0.265 5.89 7080 1680 4.2 0.525
3000 0.9 0.35 5.83 7200 1800 4.0 0.475
3600 1.02 0.47 5.91 7320 1920 3.8 0.425
4200 1.12 0.57 5.91 7440 2040 3.6 0.375
4800 1.20 0.65 5.91 7560 2160 3.5 0.275
5400 1.27 0.72 5.92 7800 2400 3.3 0.205
To demonstrate the Cooper–Jacob method of ana- this value in equation 5.43, taking care to work in a
lysis, Table 5.8 provides data for a pumping test in consistent set of units (here metres and days), gives:
which a well in a confined aquifer is pumped at a
3 −1
rate of 0.01 m s and the drawdown in the potentio- 23 × 001 × 86 2 −1
. . ,400
=
= 90
T m day eq. 5.46
. 4π
metric surface is recorded at an observation well 175 ×
situated 30 m away. The drawdown data are plotted
in Fig. 5.34 and the difference in drawdown over The storage coefficient is found from equation 5.45
one log cycle is found to be 1.75 m. Substitution of with t = 0.0022 days where s = 0m:
o