Page 196 - Hydrogeology Principles and Practice
P. 196

HYDC05  12/5/05  5:35 PM  Page 179


                                                                    Groundwater investigation techniques  179


                                                                                               BO X
                     Continued
                                                                                               5.2


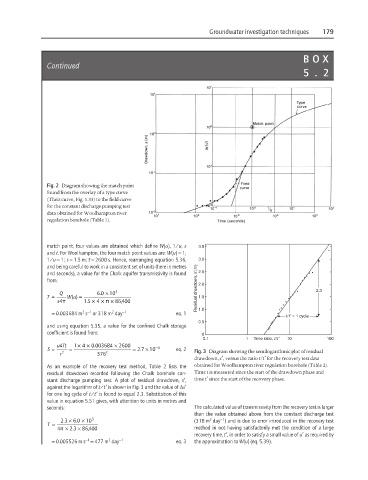
                     Fig. 2 Diagram showing the match point
                     found from the overlay of a type curve
                     (Theis curve, Fig. 5.33) to the field curve
                     for the constant discharge pumping test
                     data obtained for Woolhampton river
                     regulation borehole (Table 1).


                     match point, four values are obtained which define W(u), 1/u, s  3.5
                                                                                                      •
                     and t. For Woolhampton, the four match point values are: W(u) = 1;
                     1/u = 1; s = 1.5 m; t = 2600 s. Hence, rearranging equation 5.36,  3.0
                     and being careful to work in a consistent set of units (here in metres
                     and seconds), a value for the Chalk aquifer transmissivity is found  2.5   • • •
                     from:                                      Residual drawdown, s′(m)  2.0  •  • •
                                    .  10
                      =
                              =
                     T    Q  Wu()    60  ×  3                    1.5                       • •  • • •  2.3
                                       ×
                                  ×
                                         6
                        s4p    1 .         ,400                                          •  •
                                        8
                                   4
                                    × p
                                5
                               2 −1
                                       2
                      = 0.003684 m s or 318 m day −1      eq. 1  1.0                    • • •
                                                                                       •  t/t ′ = 1 cycle
                                                                 0.5                  • • • •
                     and using equation 5.35, a value for the confined Chalk storage  • • •
                     coefficient is found from:                    0
                                                                  0.1          1  Time ratio, t/t′  10  100
                                ×
                                        ×
                        4
                              × 4
                     S  =  uTt     1       . 0 003684   2600    .   10 −4  eq. 2  Fig. 3 Diagram showing the semilogarithmic plot of residual
                           =
                                                 ×
                                              = 27
                        r  2       376 2
                                                               drawdown, s′, versus the ratio t/t′ for the recovery test data
                     As an example of the recovery test method, Table 2 lists the   obtained for Woolhampton river regulation borehole (Table 2).
                     residual drawdown recorded following the Chalk borehole con-  Time t is measured since the start of the drawdown phase and
                     stant discharge pumping test. A plot of residual drawdown,  s′,  time t′ since the start of the recovery phase.
                     against the logarithm of t/t′ is shown in Fig. 3 and the value of ∆s′
                     for one log cycle of t/t′ is found to equal 2.3. Substitution of this
                     value in equation 5.51 gives, with attention to units in metres and
                     seconds:                                  The calculated value of transmissivity from the recovery test is larger
                                                               than the value obtained above from the constant discharge test
                                                                    2
                                                                       −1
                         .   .   10
                      =
                     T    23  ×  60  ×  3                      (318 m day ) and is due to error introduced in the recovery test
                              ×
                          ×
                            3
                           2
                        4p    .   ,400                          method in not having satisfactorily met the condition of a large
                                6
                               8
                                                                recovery time, t′, in order to satisfy a small value of u′ as required by
                                −1
                                       2
                      = 0.005526 m s = 477 m day −1       eq. 3  the approximation to W(u) (eq. 5.39).
   191   192   193   194   195   196   197   198   199   200   201