
Page 188 - Hydrogeology Principles and Practice
P. 188
HYDC05 12/5/05 5:35 PM Page 171
Groundwater investigation techniques 171
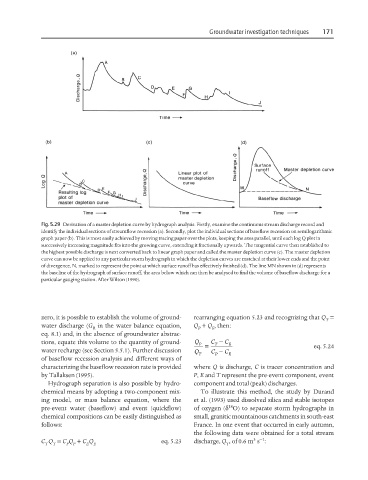
Fig. 5.29 Derivation of a master depletion curve by hydrograph analysis. Firstly, examine the continuous stream discharge record and
identify the individual sections of streamflow recession (a). Secondly, plot the individual sections of baseflow recession on semilogarithmic
graph paper (b). This is most easily achieved by moving tracing paper over the plots, keeping the axes parallel, until each log Q plot in
successively increasing magnitude fits into the growing curve, extending it fractionally upwards. The tangential curve then established to
the highest possible discharge is next converted back to linear graph paper and called the master depletion curve (c). The master depletion
curve can now be applied to any particular storm hydrograph in which the depletion curves are matched at their lower ends and the point
of divergence, N, marked to represent the point at which surface runoff has effectively finished (d). The line MN shown in (d) represents
the baseline of the hydrograph of surface runoff, the area below which can then be analysed to find the volume of baseflow discharge for a
particular gauging station. After Wilson (1990).
zero, it is possible to establish the volume of ground- rearranging equation 5.23 and recognizing that Q =
T
water discharge (G in the water balance equation, Q + Q , then:
R P E
eq. 8.1) and, in the absence of groundwater abstrac-
tions, equate this volume to the quantity of ground- Q P C − C E eq. 5.24
=
T
water recharge (see Section 5.5.1). Further discussion Q C − C
T P E
of baseflow recession analysis and different ways of
characterizing the baseflow recession rate is provided where Q is discharge, C is tracer concentration and
by Tallaksen (1995). P, E and T represent the pre-event component, event
Hydrograph separation is also possible by hydro- component and total (peak) discharges.
chemical means by adopting a two-component mix- To illustrate this method, the study by Durand
ing model, or mass balance equation, where the et al. (1993) used dissolved silica and stable isotopes
18
pre-event water (baseflow) and event (quickflow) of oxygen (δ O) to separate storm hydrographs in
chemical compositions can be easily distinguished as small, granitic mountainous catchments in south-east
follows: France. In one event that occurred in early autumn,
the following data were obtained for a total stream
3 −1
C Q = C Q + C Q eq. 5.23 discharge, Q , of 0.6 m s :
T T P P E E T