
Page 217 - Hydrogeology Principles and Practice
P. 217
HYDC06 12/5/05 5:33 PM Page 200
200 Chapter Six
BO X
The ‘hard-water story’
6.1
The history and debate surrounding whether hard water protects soft and medium-hard waters. Importantly, adjusting for climatic
against cardiovascular disease (CVD) is often referred to as the and socioeconomic differences considerably reduced the apparent
‘hard-water story’ and started with a Japanese agricultural chemist. magnitude of the effect of water hardness (Pocock et al. 1980).
Kobayashi (1957) had for many years studied the nature of agricul- A problem with correlation studies such as the British Regional
tural irrigation water and found a close relation between the chem- Heart Study, as argued by Jones and Moon (1987), is the failure of
ical composition of river water and the death rate from ‘apoplexy’ much of the research to consider the causal mechanism that links
(cerebrovascular disease). The death rate from apoplexy in Japan independent variables to the disease outcome. Also, many of the
was extraordinarily high compared to other countries, and the calibrated models presented in the literature are socially blind in
biggest cause of death in Japan. Kobayashi (1957) found that it including only those variables pertaining to the physical environ-
was especially the ratio of sulphur to carbonate (SO /CaCO ) in ment, often a large number of water quality elements. Even in those
3
4
drinking water that was related to the death rate from apoplexy and better analyses that have included social variables, as in the case of
suggested that inorganic acid might induce, or CaCO prevent, the British Regional Heart Study, the relatively strong correlation
3
apoplexy. found for Ca in England and Wales may be a result of Ca acting as a
Since Kobayashi (1957), and in different parts of the world, many very good surrogate for social variables. The soft-water areas of the
studies have been completed on the relation between Ca and Mg in north and west of the country equate to the areas of early industri-
local drinking water, and CVD mortality. These studies are generally alization, and today these areas house a disproportionate percent-
based upon death registers and water quality data at regional or age of the socially disadvantaged (Jones & Moon 1987). Therefore,
municipality levels. Even with all these studies, the results are not it is important that further studies undertake the challenge of quan-
conclusive as to the role of Ca and Mg in drinking water for CVD. titatively analysing the separate effects of social variables from
However, most of these studies are ‘ecological’, meaning that the those of water hardness.
exposure to water constituents is determined at group levels with a Fewer studies have been carried out in developing countries, but
high risk of misclassification. Often, very large groups, for example Dissanayake et al. (1982), for example, found a negative correla-
all inhabitants in large cities or areas, are assigned the same value tion between water hardness and various forms of CVD and
of water Ca and Mg, despite the presence of several waterworks or leukaemia in Sri Lanka.
private wells. In addition, the disease diagnoses studied are some-
times unspecific, with wide definitions that include both cardiac
and cerebrovascular diseases. In some studies, it is also unclear
whether the range of Ca and Mg in drinking water is large enough
to allow for appropriate analyses.
One of the most comprehensive studies of the geographic varia-
tions in cardiovascular mortality was the British Regional Heart
Study. The first phase of this study (Pocock et al. 1980) applied mul-
tiple regression analysis to the geographical variations in CVD for
men and women aged 35–74 in 253 urban areas in England, Wales
and Scotland for the period 1969–1973. The investigation showed
that the relationship to water hardness was non-linear, being much
greater in the range from very soft to medium-hard water than from
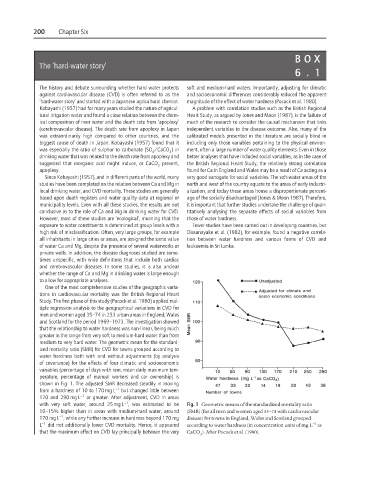
medium to very hard water. The geometric mean for the standard-
ized mortality ratio (SMR) for CVD for towns grouped according to
water hardness both with and without adjustments (by analysis
of covariance) for the effects of four climatic and socioeconomic
variables (percentage of days with rain, mean daily maximum tem-
perature, percentage of manual workers and car ownership) is
shown in Fig. 1. The adjusted SMR decreased steadily in moving
from a hardness of 10 to 170 mg L −1 but changed little between
170 and 290 mg L −1 or greater. After adjustment, CVD in areas
−1
with very soft water, around 25 mg L , was estimated to be Fig. 1 Geometric means of the standardized mortality ratio
10–15% higher than in areas with medium-hard water, around (SMR) (for all men and women aged 35–74 with cardiovascular
−1
170 mg L , while any further increase in hardness beyond 170 mg disease) for towns in England, Wales and Scotland grouped
−1
L −1 did not additionally lower CVD mortality. Hence, it appeared according to water hardness (in concentration units of mg L as
that the maximum effect on CVD lay principally between the very CaCO ). After Pocock et al. (1980).
3