
Page 27 - Hydrogeology Principles and Practice
P. 27
HYDC01 12/5/05 5:44 PM Page 10
10 Chapter One
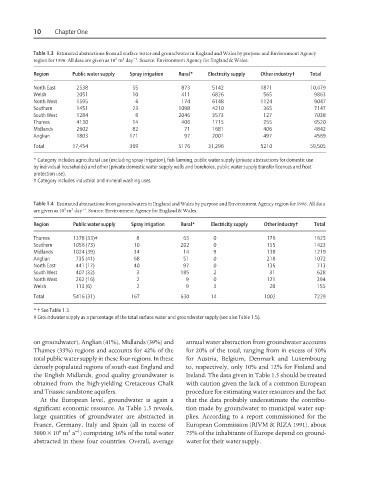
Table 1.3 Estimated abstractions from all surface water and groundwater in England and Wales by purpose and Environment Agency
3
3
−1
region for 1996. All data are given as 10 m day . Source: Environment Agency for England & Wales.
Region Public water supply Spray irrigation Rural* Electricity supply Other industry† Total
North East 2538 55 873 5142 1871 10,479
Welsh 2051 10 411 6826 565 9863
North West 1595 6 174 6148 1124 9047
Southern 1451 23 1098 4210 365 7147
South West 1284 8 2046 3573 127 7038
Thames 4130 14 406 1715 255 6520
Midlands 2602 82 71 1681 406 4842
Anglian 1803 171 97 2001 497 4569
Total 17,454 369 5176 31,296 5210 59,505
* Category includes agricultural use (excluding spray irrigation), fish farming, public water supply (private abstractions for domestic use
by individual households) and other (private domestic water supply wells and boreholes, public water supply transfer licences and frost
protection use).
† Category includes industrial and mineral washing uses.
Table 1.4 Estimated abstractions from groundwaters in England and Wales by purpose and Environment Agency region for 1996. All data
3
3
−1
are given as 10 m day . Source: Environment Agency for England & Wales.
Region Public water supply Spray irrigation Rural* Electricity supply Other industry† Total
Thames 1378 (33)‡ 8 63 0 176 1625
Southern 1056 (73) 10 202 0 155 1423
Midlands 1024 (39) 34 14 9 138 1219
Anglian 735 (41) 68 51 0 218 1072
North East 441 (17) 40 97 0 135 713
South West 407 (32) 3 185 2 31 628
North West 262 (16) 2 9 0 121 394
Welsh 113 (6) 2 9 3 28 155
Total 5416 (31) 167 630 14 1002 7229
*† See Table 1.3.
‡ Groundwater supply as a percentage of the total surface water and groundwater supply (see also Table 1.5).
on groundwater), Anglian (41%), Midlands (39%) and annual water abstraction from groundwater accounts
Thames (33%) regions and accounts for 42% of the for 20% of the total, ranging from in excess of 50%
total public water supply in these four regions. In these for Austria, Belgium, Denmark and Luxembourg
densely populated regions of south-east England and to, respectively, only 10% and 12% for Finland and
the English Midlands, good quality groundwater is Ireland. The data given in Table 1.5 should be treated
obtained from the high-yielding Cretaceous Chalk with caution given the lack of a common European
and Triassic sandstone aquifers. procedure for estimating water resources and the fact
At the European level, groundwater is again a that the data probably underestimate the contribu-
significant economic resource. As Table 1.5 reveals, tion made by groundwater to municipal water sup-
large quantities of groundwater are abstracted in plies. According to a report commissioned for the
France, Germany, Italy and Spain (all in excess of European Commission (RIVM & RIZA 1991), about
6
3 −1
5000 × 10 m a ) comprising 16% of the total water 75% of the inhabitants of Europe depend on ground-
abstracted in these four countries. Overall, average water for their water supply.