Page 25 - Hydrogeology Principles and Practice
P. 25

HYDC01  12/5/05  5:44 PM  Page 8


                 8    Chapter One


                 Table 1.1 Inventory of water at or near the Earth’s surface. After  is locked in glacial ice or is saline (Fig. 1.6). The relat-
                 Berner and Berner (1987).                   ive importance of groundwater can be realized when
                                                             it is considered that, of the remaining quarter of water
                 Reservoir              Volume    % of total
                                         ×
                                            6
                                               3
                                        (× 10 km )           in land areas, around 98% is stored underground. In
                                                             addition to the more accessible groundwater involved
                 Oceans                 1370       97.25     in the water cycle above a depth of 4 km, estimates of
                 Ice caps and glaciers    29        2.05     the volume of interstitial water in rock pores at even
                 Deep groundwater (750–4000 m)  5.3  0.38    greater depths range from 53 × 10 km (Ambroggi
                                                                                        6
                                                                                            3
                 Shallow groundwater (<750 m)  4.2  0.30                  6   3
                 Lakes                     0.125    0.01     1977) to 320 × 10 km (Garrels et al. 1975).
                 Soil moisture             0.065    0.005      Within the water cycle, and in order to conserve
                 Atmosphere*               0.013    0.001    total water, evaporation must balance precipitation
                 Rivers                    0.0017   0.0001   for the Earth as a whole. The average global precip-
                 Biosphere                 0.0006   0.00004
                                                             itation rate, which is equal to the evaporation rate, is
                                                                      3 −1
                 Total                  1408.7    100        496,000 km a . However, as Fig. 1.5 shows, for any
                                                             one portion of the Earth, evaporation and precip-
                 * As liquid equivalent of water vapour.
                                                             itation generally do not balance. The differences
                                                             comprise water transported from the oceans to the
                                                             continents as atmospheric water vapour and water
                                                             returned to the oceans as river runoff and a small
                                                             amount (~6%) of direct groundwater discharge to
                                                             the oceans (Zektser & Loáiciga 1993).
                                                               The approximate breakdown of direct groundwa-
                                                             ter discharge from continents to adjacent oceans and
                                                                                                  3 −1
                                                             seas is estimated as follows: Australia 24 km a ;
                                                                         3 −1
                                                                                        3 −1
                                                             Europe 153 km a ; Africa 236 km a ; Asia 328 km 3
                                                                                  3 −1
                                                              −1
                                                             a ; the Americas 729 km a ; and major islands
                                                                   3 −1
                                                             914 km a (Zektser & Loáiciga 1993). The low con-
                                                             tribution from the Australian continent of direct
                                                             groundwater discharge, despite its relatively large
                                                             territory, is attributed to the widespread occurrence
                                                             of low-permeability surface rocks that cover the con-
                                                             tinent. At the other extreme, the overall proximity of
                                                             recharge areas to discharge areas is the reason why
                                                             major islands of the world contribute over one-third
                                                             of the world’s direct groundwater discharge to the
                                                             oceans. The largest direct groundwater flows to oceans
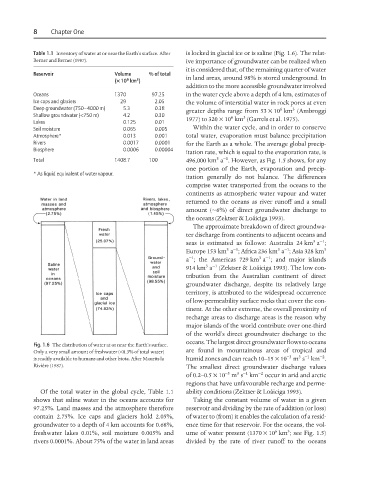
                 Fig. 1.6 The distribution of water at or near the Earth’s surface.
                 Only a very small amount of freshwater (<0.3% of total water)   are found in mountainous areas of tropical and
                                                                                              3 −1
                                                                                          −3
                                                                                                    −2
                 is readily available to humans and other biota. After Maurits la  humid zones and can reach 10–15 × 10 m s km .
                 Riviére (1987).                             The smallest direct groundwater discharge values
                                                                            3 −1
                                                                                  −2
                                                                        −3
                                                             of 0.2–0.5 × 10 m s km occur in arid and arctic
                                                             regions that have unfavourable recharge and perme-
                   Of the total water in the global cycle, Table 1.1  ability conditions (Zektser & Loáiciga 1993).
                 shows that saline water in the oceans accounts for  Taking the constant volume of water in a given
                 97.25%. Land masses and the atmosphere therefore  reservoir and dividing by the rate of addition (or loss)
                 contain 2.75%. Ice caps and glaciers hold 2.05%,  of water to (from) it enables the calculation of a resid-
                 groundwater to a depth of 4 km accounts for 0.68%,  ence time for that reservoir. For the oceans, the vol-
                                                                                           3
                                                                                       6
                 freshwater lakes 0.01%, soil moisture 0.005% and  ume of water present (1370 × 10 km ; see Fig. 1.5)
                 rivers 0.0001%. About 75% of the water in land areas  divided by the rate of river runoff to the oceans
   20   21   22   23   24   25   26   27   28   29   30