
Page 28 - Hydrogeology Principles and Practice
P. 28
HYDC01 12/5/05 5:44 PM Page 11
Introduction 11
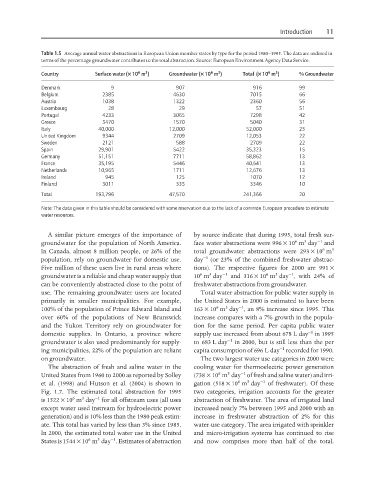
Table 1.5 Average annual water abstractions in European Union member states by type for the period 1980–1995. The data are ordered in
terms of the percentage groundwater contributes to the total abstraction. Source: European Environment Agency Data Service.
×
×
×
3
6
6
6
3
3
Country Surface water (× 10 m ) Groundwater (× 10 m ) Total (× 10 m ) % Groundwater
Denmark 9 907 916 99
Belgium 2385 4630 7015 66
Austria 1038 1322 2360 56
Luxembourg 28 29 57 51
Portugal 4233 3065 7298 42
Greece 3470 1570 5040 31
Italy 40,000 12,000 52,000 23
United Kingdom 9344 2709 12,053 22
Sweden 2121 588 2709 22
Spain 29,901 5422 35,323 15
Germany 51,151 7711 58,862 13
France 35,195 5446 40,641 13
Netherlands 10,965 1711 12,676 13
Ireland 945 125 1070 12
Finland 3011 335 3346 10
Total 193,796 47,570 241,366 20
Note: The data given in this table should be considered with some reservation due to the lack of a common European procedure to estimate
water resources.
A similar picture emerges of the importance of by source indicate that during 1995, total fresh sur-
−1
3
6
groundwater for the population of North America. face water abstractions were 996 × 10 m day and
6
In Canada, almost 8 million people, or 26% of the total groundwater abstractions were 293 × 10 m 3
population, rely on groundwater for domestic use. day −1 (or 23% of the combined freshwater abstrac-
Five million of these users live in rural areas where tions). The respective figures for 2000 are 991 ×
3
3
−1
6
6
groundwater is a reliable and cheap water supply that 10 m day −1 and 316 × 10 m day , with 24% of
can be conveniently abstracted close to the point of freshwater abstractions from groundwater.
use. The remaining groundwater users are located Total water abstraction for public water supply in
primarily in smaller municipalities. For example, the United States in 2000 is estimated to have been
−1
3
6
100% of the population of Prince Edward Island and 163 × 10 m day , an 8% increase since 1995. This
over 60% of the populations of New Brunswick increase compares with a 7% growth in the popula-
and the Yukon Territory rely on groundwater for tion for the same period. Per capita public water
−1
domestic supplies. In Ontario, a province where supply use increased from about 678 L day in 1995
groundwater is also used predominantly for supply- to 683 L day −1 in 2000, but is still less than the per
−1
ing municipalities, 22% of the population are reliant capita consumption of 696 L day recorded for 1990.
on groundwater. The two largest water use categories in 2000 were
The abstraction of fresh and saline water in the cooling water for thermoelectric power generation
3
−1
6
United States from 1960 to 2000 as reported by Solley (738 × 10 m day of fresh and saline water) and irri-
3
6
et al. (1998) and Hutson et al. (2004) is shown in gation (518 × 10 m day −1 of freshwater). Of these
Fig. 1.7. The estimated total abstraction for 1995 two categories, irrigation accounts for the greater
6
3
−1
is 1522 × 10 m day for all offstream uses (all uses abstraction of freshwater. The area of irrigated land
except water used instream for hydroelectric power increased nearly 7% between 1995 and 2000 with an
generation) and is 10% less than the 1980 peak estim- increase in freshwater abstraction of 2% for this
ate. This total has varied by less than 3% since 1985. water-use category. The area irrigated with sprinkler
In 2000, the estimated total water use in the United and micro-irrigation systems has continued to rise
−1
6
3
States is 1544 × 10 m day . Estimates of abstraction and now comprises more than half of the total.