
Page 271 - Hydrogeology Principles and Practice
P. 271
HYDC07 12/5/05 5:32 PM Page 254
BO X
Continued
7. 2
Groundwater levels were monitored regularly, and within 2 that Well 3 tapped a ‘pool’ of kerosene isolated from the effects of
months the cone of depression in the water table produced by the Wells 1 and 2 by the foundations of the Technical Blocks. A further
pumping of Wells 1 and 2 encompassed the estimated area of the 10,100 L of kerosene were removed from Well 3 (Fig. 3), making a
kerosene ‘pancake’. Initially, the recovery rate was such that 19,200 total recovery of 29,300 L of kerosene in 4 years at which point the
L of kerosene were removed (Fig. 3) and sold to be blended into removal of the original kerosene ‘pancake’ was considered to be
commercial heating oil. The recovery rate then dropped substan- complete. Although active remediation by pump-and-treat ended at
tially, yet the kerosene layer in borehole 11 still remained unaltered, this time, kerosene recovery using passive collectors, for example
suggesting that Wells 1 and 2 were not affecting the southern part absorbent mops, in the three wells continued for about another year.
of the kerosene ‘pancake’. Later, Well 3 was installed. It is believed The clean-up project officially ended in 1994 (Clark & Sims 1998).
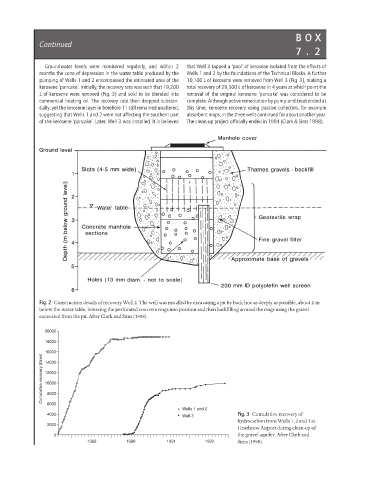
Fig. 2 Construction details of recovery Well 2. The well was installed by excavating a pit by back-hoe as deeply as possible, about 2 m
below the water table, lowering the perforated concrete rings into position and then backfilling around the rings using the gravel
excavated from the pit. After Clark and Sims (1998).
20000
18000
16000
Cumulative recovery (litres) 12000 • • • • • • • • • • • • • • •
14000
10000
8000
6000
• • • • • • • • • • • • • • • • • • Wells 1 and 2
4000 • • • Well 3 Fig. 3 Cumulative recovery of
• • • hydrocarbon from Wells 1, 2 and 3 at
2000 • • • • •
• • Heathrow Airport during clean-up of
0 • • • • • • • • • • the gravel aquifer. After Clark and
1989 1990 1991 1992 Sims (1998).