
Page 275 - Improving Machinery Reliability
P. 275
246 Improving Machinery Reliability
Certifiable training costs per employee
Maintenance-related downtime
To assure accurate comparisons, it is extremely important that measurements be
calculated in the same manner from consistent data. Calculations also must be clear-
ly understood for meaningful comparisons. For example, the exact elements that
generate “cost of goods sold” or “total production cost” vary from business to busi-
ness and must be calculated consistently for an accurate comparison.
Another example is in the use of the number of service maintenance employees.
The appropriateness of this measure depends on the level of facility automation.
More maintenance workers may be required to support the automated operation,
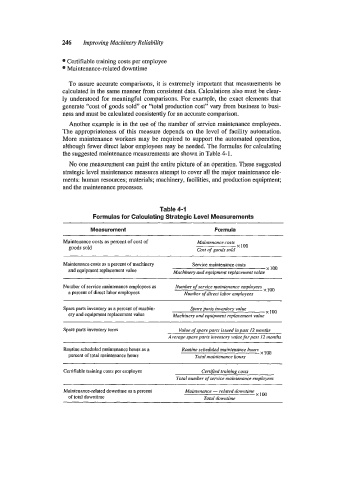
although fewer direct labor employees may be needed. The formulas for calculating
the suggested maintenance measurements are shown in Table 4-1.
No one measurement can paint the entire picture of an operation. These suggested
strategic level maintenance measures attempt to cover all the major maintenance ele-
ments: human resources; materials; machinery, facilities, and production equipment;
and the maintenance processes.
Table 4-1
Formulas for Calculating Strategic Level Measurements
Measurement Formula
Maintenance costs as percent of cost of Maintenance costs
goods sold Cost of goods sold x 100
Maintenance costs as a percent of machinery Service maintenance costs
and equipment replacement value Machinery and equipment replacement value x 100
Number of service maintenance employees as Number of service maintenance employees
a percent of direct labor employees Number of direct labor employees X 100
Spare parts inventory as a percent of machin- Spare parts inventory value
ery and equipment replacement value Machinery and equipment replacement value X 100
Spare parts inventory turns Value of spare parts issued in past 12 months
Average spare parts inventory value for past 12 months
Routine scheduled maintenance hours as a Routine scheduled maintenance hours
percent of total maintenance hours Total maintenance hours x 100
Certifiable training costs per employee Certified training costs
Total number of service maintenance employees
Maintenance-related downtime as a percent Maintenance - related downtime
of total downtime Total downtime x 100