
Page 280 - Improving Machinery Reliability
P. 280
Maintenance and Benchmarking Reliability 251
The message is that management practices are widely divergent. They represent
some very different approaches to managing resource consumption in a competitive
environment. Those in the high-cost group may find it hard to remain viable.
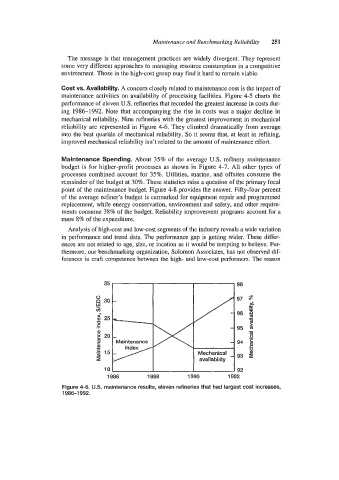
Cost vs. Availability. A concern closely related to maintenance cost is the impact of
maintenance activities on availability of processing facilities. Figure 4-5 charts the
performance of eleven U.S. refineries that recorded the greatest increase in costs dur-
ing 1986-1992. Note that accompanying the rise in costs was a major decline in
mechanical reliability. Nine refineries with the greatest improvement in mechanical
reliability are represented in Figure 4-6. They climbed dramatically from average
into the best quartile of mechanical reliability. So it seems that, at least in refining,
improved mechanical reliability isn’t related to the amount of maintenance effort.
Maintenance Spending. About 35% of the average U.S. refinery maintenance
budget is for higher-profit processes as shown in Figure 4-7. All other types of
processes combined account for 35%. Utilities, marine, and offsites consume the
remainder of the budget at 30%. These statistics raise a question of the primary focal
point of the maintenance budget. Figure 4-8 provides the answer. Fifty-four percent
off the average refiner’s budget is earmarked for equipment repair and programmed
replacement, while energy conservation, environment and safety, and other require-
ments consume 38% of the budget. Reliability improvement programs account for a
mere 8% of the expenditure.
Analysis of high-cost and low-cost segments of the industry reveals a wide variation
in performance and trend data. The performance gap is getting wider. These differ-
ences are not related to age, size, or location as it would be tempting to believe. Fur-
thermore, our benchmarking organization, Solomon Associates, has not observed dif-
ferences in craft competence between the high- and low-cost performers. The reason
98
97
96
95
94
93
92
1986 1988 1990 1992
Figure 4-5. US. maintenance results, eleven refineries that had largest cost increases,
1986-1 992.