
Page 279 - Improving Machinery Reliability
P. 279
250 Improving Machinery Reliability
Figure 4-3. Cash basis, ROI, in percent.
40
35
30
25
20
15
10
1986 1988 1990 1992
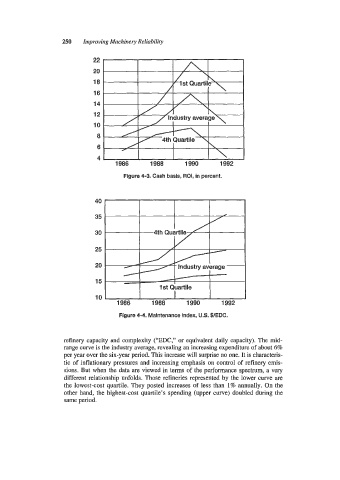
Figure 4-4. Maintenance index, U.S. $/EDC.
refinery capacity and complexity (“EDC,” or equivalent daily capacity). The mid-
range curve is the industry average, revealing an increasing expenditure of about 6%
per year over the six-year period. This increase will surprise no one, It is characteris-
tic of inflationary pressures and increasing emphasis on control of refinery emis-
sions. But when the data are viewed in terms of the performance spectrum, a very
different relationship unfolds. Those refineries represented by the lower curve are
the lowest-cost quartile. They posted increases of less than 1% annually. On the
other hand, the highest-cost quartile’s spending (upper curve) doubled during the
same period.