
Page 385 - Industrial Power Engineering and Applications Handbook
P. 385
13/360 Industrial Power Engineering and Applications Handbook
Table 13.11 Multiplying factors to obtain the momentary peak
3.0 (maximum r.m.s. or dynamic) values of the short-circuit
currents including the sub-transient d.c. component at
different power factors (R/XL)
2.5 Prospective short-circuit Factor of asymmetry to Cos Q
2.0 t or short-time current; obtain the peak short
Isc kA(xm.s.) (symmetrical circuit or making
6 breaking current) current I, WXL)
$
1.5 $ (a) For LT systems
(II up to 5 1.5 0.7
% Above 5 to 10 1.7 0.5
1.0 8 Above 10 to 20 2.0 0.3
Above 20 to 50
2.1
0.25
3 More than 50 2.2 0.2
(b) For HT systems Min. 2.5 -
0.5
Note For CTs this multiplying factor has been specified as 2.5 for
all voltage systems, as in IEC 60044-1. See also Section 15.7 for
metering and protection current transformers.
U
0.2 0.4 0.6 0.8 1.0
cos @ (tuxL) -c
Example 13.5
For a 50 kA(r.m.s.) fault level on an LT system, the momentary
Figure 13.22 Approximate time of decay of the d.c. component peak value of the fault current, C, will be = 50 x 2.1 = 105 kA.
and the factor of asymmetry as a function of system P.F. during
a fault
8 Causes of asymmetry
Acurrent wave propagating symmetrically about its zero
axis, i.e. when the envelopes of the peaks of the current
wave are symmetrical about its zero axis, is termed
4 When designing a current-carrying system it is the r.m.s. value
of the fault current, Isc, that is relevant to determine the thermal symmetrical (Figure 13.24) and a wave unable to maintain
stresses (= I&) during a fault, to choose the correct material this symmetry is termed asymmetrical (Figure 13.25).
and size of the current-carrying components. (The duration of The p.f. during a short-circuit as noted in Section 13.4.1
asymmetry is too short to cause any significant heating of the is quite low, and is normally of the order of 0.1. The
current-carrying components.) current will now lag the voltage by nearly 84" (Figure
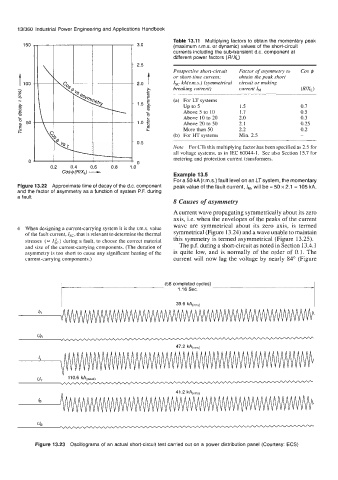
(58 completed cycles)
1.16 Sec.
Figure 13.23 Oscillograms of an actual short-circuit test carried out on a power distribution panel (Courtesy: ECS)