
Page 43 - Innovations in Intelligent Machines
P. 43
Predicting Operator Capacity for Supervisory Control of Multiple UAVs 31
4
x 10
2
1.8
1.6 Cost curve
1.4 with wait
1.2 times included
Cost 1
0.8
0.6
0.4
0.2
0
1 2 3 4 5 6 7 8 9 10
Number of UAVs
(a)
x 10 4
2
1.8
1.6
1.4
1.2
Cost 1
0.8
0.6
0.4
0.2
0
1 2 3 4 5 6 7 8 9 10
Number of UAVs
(b)
x 10 4
2
1.8
1.6
1.4
1.2
Cost 1
0.8
0.6
0.4
0.2
0
1 2 3 4 5 6 7 8 9 10
Number of UAVs
(c)
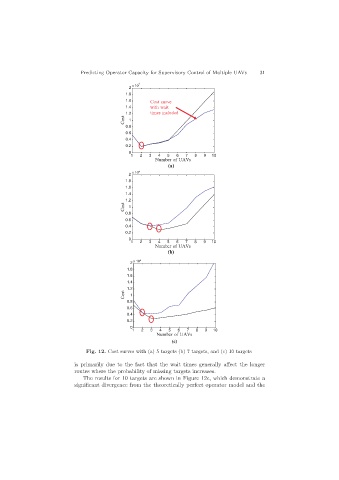
Fig. 12. Cost surves with (a) 5 targets (b) 7 targets, and (c) 10 targets
is primarily due to the fact that the wait times generally affect the longer
routes where the probability of missing targets increases.
The results for 10 targets are shown in Figure 12c, which demonstrate a
significant divergence from the theoretically perfect operator model and the