
Page 39 - Innovations in Intelligent Machines
P. 39
Predicting Operator Capacity for Supervisory Control of Multiple UAVs 27
In terms of wait times, any additional time a vehicle spends in a degraded
state will add to the overall cost expressed in (5). Wait times that could incre-
ase mission cost can be attributed to 1) Missing a target which could either
mean physically not sending a UAV to the required target or sending it out-
side its established TOT window, and 2) Adding flight time through route
mismanagement, which in turn increases fuel and operational costs. Thus,
wait times will shift the cost curve upwards. However, because wait times will
likely be greater in a system with more events, and hence more UAVs, we
expect the curve to shift upwards to a greater extent as the number of UAVs
is increased.
In order to account for wait times in a cost-performance model, which
as previously demonstrated is critical in obtaining a more accurate operator
capacity prediction, we need a model of the human in our MUAV system,
which we detail in the next section.
3.5 The Human Model
Since the human operator’s job is essentially to “service” vehicles, one way to
model the human operator is through queuing theory. The simplest example
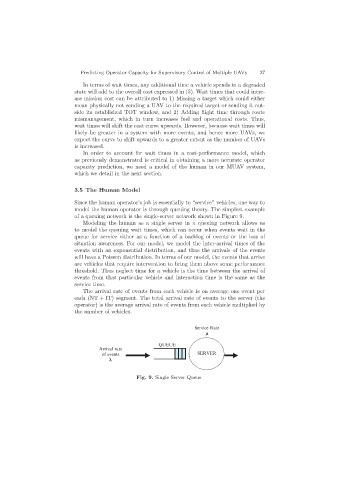
of a queuing network is the single-server network shown in Figure 9.
Modeling the human as a single server in a queuing network allows us
to model the queuing wait times, which can occur when events wait in the
queue for service either as a function of a backlog of events or the loss of
situation awareness. For our model, we model the inter-arrival times of the
events with an exponential distribution, and thus the arrivals of the events
will have a Poisson distribution. In terms of our model, the events that arrive
are vehicles that require intervention to bring them above some performance
threshold. Thus neglect time for a vehicle is the time between the arrival of
events from that particular vehicle and interaction time is the same as the
service time.
The arrival rate of events from each vehicle is on average one event per
each (NT + IT) segment. The total arrival rate of events to the server (the
operator) is the average arrival rate of events from each vehicle multiplied by
the number of vehicles.
Service Rate
µ
QUEUE
Arrival rate
of events SERVER
l
Fig. 9. Single Server Queue