
Page 44 - Innovations in Intelligent Machines
P. 44
32 M.L. Cummings et al.
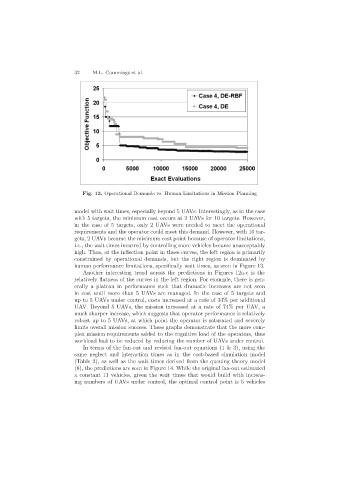
Fig. 13. Operational Demands vs. Human Limitations in Mission Planning
model with wait times, especially beyond 5 UAVs. Interestingly, as in the case
with 5 targets, the minimum cost occurs at 2 UAVs for 10 targets. However,
in the case of 5 targets, only 2 UAVs were needed to meet the operational
requirements and the operator could meet this demand. However, with 10 tar-
gets, 2 UAVs became the minimum cost point because of operator limitations,
i.e., the wait times incurred by controlling more vehicles became unacceptably
high. Thus, at the inflection point in these curves, the left region is primarily
constrained by operational demands, but the right region is dominated by
human performance limitations, specifically wait times, as seen in Figure 13.
Another interesting trend across the predictions in Figures 12a-c is the
relatively flatness of the curves in the left region. For example, there is gen-
erally a plateau in performance such that dramatic increases are not seen
in cost until more than 5 UAVs are managed. In the case of 5 targets and
up to 5 UAVs under control, costs increased at a rate of 33% per additional
UAV. Beyond 5 UAVs, the mission increased at a rate of 74% per UAV, a
much sharper increase, which suggests that operator performance is relatively
robust up to 5 UAVs, at which point the operator is saturated and severely
limits overall mission success. These graphs demonstrate that the more com-
plex mission requirements added to the cognitive load of the operators, thus
workload had to be reduced by reducing the number of UAVs under control.
In terms of the fan-out and revised fan-out equations (1 & 3), using the
same neglect and interaction times as in the cost-based simulation model
(Table 2), as well as the wait times derived from the queuing theory model
(8), the predictions are seen in Figure 14. While the original fan-out estimated
a constant 11 vehicles, given the wait times that would build with increas-
ing numbers of UAVs under control, the optimal control point is 5 vehicles