
Page 351 - Instrumentation Reference Book 3E
P. 351
334 Chemical analysis: spectroscopy
MicroDhone n
first-order perturbations. In the radio frequency
(r.f.) region, the nuclear effects are directly observ-
able. (Especially important today is the observa-
tion in the microwave region of paramagnetic
resonance absorption (PMR) and also nuclear
magnetic resonance. Both these techniques will
be discussed briefly in a later section.) As in any
other type of absorption spectroscopy, the instru-
ment required consists of a source of radiation, a
sample cell and detector. Unlike optical spectro-
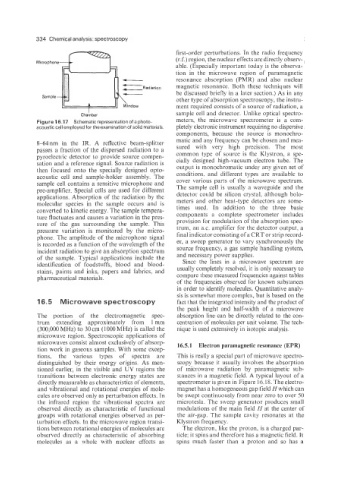
Chamber
Figure 16.17 Schematic representation of a photo- meters, the microwave spectrometer is a com-
acoustic cell employed for the examination of solid materials. pletely electronic instrument requiring no dispersive
components, because the source is monochro-
matic and any frequency can be chosen and mea-
8-64 nm in the IR. A reflective beam-splitter
passes a fraction of the dispersed radiation to a sured with very high precision. The most
common type of source is the Klystron, a spe-
pyroelectric detector to provide source compen- cially designed high-vacuum electron tube. The
sation and a reference signal. Source radiation is output is monochromatic under any given set of
then focused onto the specially designed opto- conditions, and different types are available to
acoustic cell and sample-holder assembly. The cover various parts of the microwave spectrum.
sample cell contains a sensitive microphone and
pre-amplifier. Special cells are used for different The sample cell is usually a waveguide and the
applications. Absorption of the radiation by the detector could be silicon crystal, although bolo-
molecular species in the sample occurs and is meters and other heat-type detectors are some-
times used. In addition to the three basic
converted to kinetic energy. The sample tempera- components a complete spectrometer includes
ture fluctuates and causes a variation in the pres- provision for modulation of the absorption spec-
sure of the gas surrounding the sample. This
pressure variation is monitored by the micro- trum, an ax. amplifier for the detector output, a
phone. The amplitude of the microphone signal final indicator consisting of a CRT or strip record-
is recorded as a function of the wavelength of the er, a sweep generator to vary synchronously the
incident radiation to give an absorption spectrum source frequency, a gas sample handling system,
of the sample. Typical applications include the and necessary power supplies.
identification of foodstuffs, blood and blood- Since the lines in a microwave spectrum are
stains, paints and inks, papers and fabrics, and usually completely resolved, it is only necessary to
pharmaceutical materials. compare these measured frequencies against tables
of the frequencies observed for known substances
in order to identify molecules. Quantitative analy-
sis is somewhat more complex, but is based on the
16.5 Microwave spectroscopy fact that the integrated intensity and the product of
the peak height and half-width of a microwave
The portion of the electromagnetic spec- absorption line can be directly related to the con-
trum extending approximately from 1 mm centration of molecules per unit volume. The tech-
(300,000 MHz) to 30 cm (1000 MHz) is called the nique is used extensively in isotopic analysis.
microwave region. Spectroscopic applications of
microwaves consist almost exclusively of absorp- 16.5.1 Electron paramagnetic resonance (EPR)
tion work in gaseous samples. With some excep-
tions, the various types of spectra are This is really a special part of microwave spectro-
distinguished by their energy origins. As men- scopy because it usually involves the absorption
tioned earlier, in the visible and UV regions the of microwave radiation by paramagnetic sub-
transitions between electronic energy states are stances in a magnetic field. A typical layout of a
directly measurable as characteristics of elements, spectrometer is given in Figure 16.18. The electro-
and vibrational and rotational energies of mole- magnet has a homogeneous gap field H which can
cules are observed only as perturbation effects. In be swept continuously from near zero to over 50
the infrared region the vibrational spectra are microtesla. The sweep generator produces small
observed directly as characteristic of functional modulations of the main field H at the center of
groups with rotational energies observed as per- the air-gap. The sample cavity resonates at the
turbation effects. In the microwave region transi- Klystron frequency.
tions between rotational energies of molecules are The electron, like the proton, is a charged par-
observed directly as characteristic of absorbing ticle; it spins and therefore has a magnetic field. It
molecules as a whole with nuclear effects as spins much faster than a proton and so has a