
Page 350 - Instrumentation Reference Book 3E
P. 350
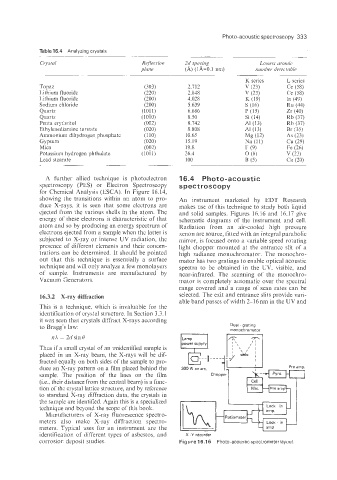
Photo-acoustic spectroscopy  333

             Table 16.4  Analyzing crystals
             Crystal                       Rejection   2d spacing             Lowest citoinic
                                           plane        (A) (IA=o.I nm)     number detectable
                                                                                      L series
             Topaz                                      2.112                         Ce (58)
             Lithium fluoride                           2.848                         Ce (58)
             Lithium fluoride                           4.028                         In (49)
             Sodium chloride                            5.639                         Ru (44)
             Quartz                                     6.686                         Zr (40)
             Quartz                                     8.50                          Rb (37)
             Penta erythritol                           8.742                         Rb (37)
             Ethylenediamine tartrate                   8.808                         Br (35)
             Ammonium dihydrogen phosphate              10.65                         As (23)
             Gypsum                                     15.19                         CLI (29)
             Mica                                       19.8                          Fe (26)
             Potassium hydrogen phthalate               26.4                          V (23)
             Lead stearate                              100                           Ca (20)

              A  further  allied  technique  is  photoelectron   16.4  Photo-acoustic
             spectroscopy  (PES)  or  Electron  Spectroscopy   spectroscopy
             for Chemical Analysis (ESCA). In Figure  16.14,
             showing  the  transitions  within  an  atom to pro-   An  instrument  marketed  by  EDT  Research
             duce  X-rays,  it  is  seen  that  some  electrons  are   makes use of this technique  to study both liquid
             ejected from the various shells in  the atom. The   and solid samples. Figures  16.16 and  16.17 give
             energy of these electrons is characteristic of that   schematic  diagrams  of  the  instrument  and  cell.
             atom and so by producing an energy spectrum of   Radiation  from  an  air-cooled  high  pressure
             electrons ejected from a sample when the latter is   xenon arc source, fitted with an integral parabolic
             scbjected to X-ray  or intense UV radiation, the   mirror, is focused onto a variable  speed rotating
             presence of  different  elements and their concen-   light  chopper  mounted  at the  entrance  slit  of  a
             trations can be determined. It should be pointed   high  radiance  monochromator. Tne monochro-
             out  that  this  technique  is  essentially  a  surface   mator has two gratings to enable optical acoustic
             technique and will only analyze a few monolayers   spectra  to  be  obtained  in  the  UV:  visible,  and
             of  sample.  Instruments  are  manufactured  by   near-infrared.  The  scanning  of  the  monochro-
             Vacuum Generators.                       mator is completely  automatic over the  spectral
                                                      range  covered and  a  range of  scan  rates can be
             16.3.2  X-ray diffraction                selected. The exit and entrance slits provide vari-
                                                      able band passes of width 2-1  6 nni in the UV and
             This  is  a  technique:  which  is  invaluable for  the
             identification of crystal structure. In Section 3.3.1
             it was seen that crystals diffract X-rays according
             to Bragg's law:                                         Dual .grating
                                                                     monochromator
                nX  = 2d sin Q
                                                       power supply
             Thus if a small crystal of an unidentified sample is
             placed  in  an  X-ray  beam,  the X-rays will  be  dif-
             fracted equally on both sides of the sample to pro-   1-
             duce an X-ray pattern on a film placed behind the   300 W xe arc.   1 ,L
             sample.  The  position  of  the  lines  on  the  film
             (i.e.. their distance from the central beam) is a func-
             tion of the crystal lattice structure, and by reference
             to standard X-ray diffraction data, the crystals in
             the sample are identified. Again this is a specialized
             technique and beyond the scope of this book.
               Manufacturers of  X-ray  fluorescence spectro-
             meters  also  make  X-ray  diffraction  spectro-
             meters.  Typical  uses  for  an  instrument  are  the
             identification of  different  types of  asbestos, and   X -Y recorder
             corrosion deposit studies.               Figure 16.1 6  Photo-acoustic spectrometer layout.