
Page 349 - Instrumentation Reference Book 3E
P. 349
332 Chemical analysis: spectroscopy
EK ‘L ‘M EN NiKa CrKa SnKa
I
Specimen
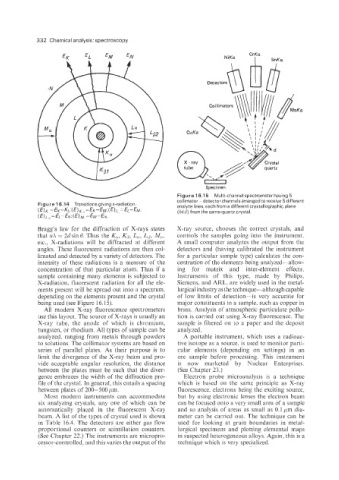
Figure 16.15 Multi-channel spectrometer having 5
collimator ~ detector channels arranged to receive 5 different
Figure 16.14 Transitionsgiving x-radiation. analyte lines, each from a different crystallographic plane
(E)K, =fK-&;(E) K~, =EK-EM; (E) L,, =EL-€,; (hkil) from the same quartz crystal.
(E) L 12 =ELPEN; (E) M,, =EM -EN.
Bragg’s law for the diffraction of X-rays states X-ray source, chooses the correct crystals, and
that izX = 2dsinO. Thus the KO, K3, La, Lg, M,, controls the samples going into the instrument.
etc., X-radiations will be diffracted at different A small computer analyzes the output from the
angles. These fluorescent radiations are then col- detectors and (having calibrated the instrument
limated and detected by a variety of detectors. The for a particular sample type) calculates the con-
intensity of these radiations is a measure of the centration of the elements being analyzed-allow-
concentration of that particular atom. Thus if a ing for matrix and inter-element effects.
sample containing many elements is subjected to Instruments of this type, made by Philips,
X-radiation, fluorescent radiation for all the ele- Siemens. and ARL, are widely used in the metal-
ments present will be spread out into a spectrum, lurgical industry as the technique-although capable
depending on the elements present and the crystal of low limits of detection-is very accurate for
being used (see Figure 16.15). major constituents in a sample, such as copper in
All modern X-ray fluorescence spectrometers brass. Analysis of atmospheric particulate pollu-
use this layout. The source of X-rays is usually an tion is carried out using X-ray fluorescence. The
X-ray tube, the anode of which is chromium, sample is filtered on to a paper and the deposit
tungsten, or rhodium. All types of sample can be analyzed.
analyzed, ranging from metals through powders A portable instrument, which uses a radioac-
to solutions. The collimator systems are based on tive isotope as a source. is used to monitor parti-
series of parallel plates. As their purpose is to cular elements (depending on settings) in an
limit the divergence of the X-ray beam and pro- ore sample before processing. This instrument
vide acceptable angular resolution, the distance is now marketed by Nuclear Enterprises.
between the plates must be such that the diver- (See Chapter 23.)
gence embraces the width of the diffraction pro- Electron probe microanalysis is a technique
file of the crystal. In general, this entails a spacing which is based on the same principle as X-ray
between plates of 200-500 pm. fluorescence, electrons being the exciting source,
Most modern instruments can accommodate but by using electronic lenses the electron beam
six analyzing crystals, any one of which can be can be focused onto a very small area of a sample
automatically placed in the fluorescent X-ray and so analysis of areas as small as 0.1 pm dia-
beam. A list of the types of crystal used is shown meter can be carried out. The technique can be
in Table 16.4. The detectors are either gas flow used for looking at grain boundaries in metal-
proportional counters or scintillation counters. lurgical specimens and plotting elemental maps
(See Chapter 22.) The instruments are micropro- in suspected heterogeneous alloys. Again, this is a
cessor-controlled, and this varies the output of the technique which is very specialized.