
Page 128 - Integrated Wireless Propagation Models
P. 128
106 C h a p t e r T h r e e
Environment (1-Mile Intercept) ( P ath Loss Slope)
Free space -45 dBm 20dB/dec
Open area -49 dBm 43.5dB/dec
Suburban -6 . 7 dBm 38.4dB/dec
1
Newark -64 dBm 43.1dB/dec
Philadelphia -70 dBm 36.8dB/dec
Tokyo, Japan -84 dBm 30.5dB/dec
New York City -77 dBm 48.0dB/dec
TABLE 3.1.2.1.1 Slope and I n tercept Reference Val u es
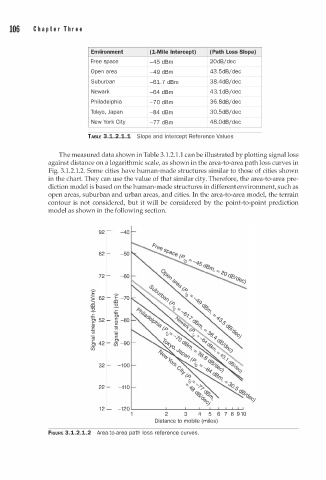
The measured data shown in Table 3.1.2 1 . 1 can be illustrated by plotting signal loss
.
against distance on a logarithmic scale, as shown in the area-to-area path loss curves in
Fig. 3.1.2.1.2. Some cities have human-made structures similar to those of cities shown
in the chart. They can use the value of that similar city. Therefore, the area-to-area pre
diction model is based on the human-made structures in different environment, such as
open areas, suburban and urban areas, and cities. In the area-to-area model, the terrain
contour is not considered, but it will be considered by the point-to-point prediction
model as shown in the following section.
92 - -40
82 - -50
72 - -60
E' �
> 62 - E -70
:::J CJ
CJ "0
2 :;
.r: c;,
g> 52 - � -80
� U5
(j) (ij
(ij §,
§, 42 - (]) -90
(])
32 - -100
22 - -11 0
1 2 - -120 '--------L---L--...l..----L-L......JL.......&__.__,
1 2 3 4 5 6 7 8 9 1 0
Distance to mobile (miles)
FIGURE 3.1.2.1.2 Area-to-area path loss reference curves.