
Page 140 - Integrated Wireless Propagation Models
P. 140
118 C h a p t e r T h r e e
3 . 1 . 3.2 Automorphology Model
The automorphology model was developed to provide users with an additional option
for modeling with multiple path loss slopes due to the absence of measured data. With
this model, morphology (for the cover-of-land conditions, such as forest or water, and
the use of land, such as human-made structures) data are used to determine the path
loss slopes beyond the 1-mile intercept. The morphology attribute types can be grouped
appropriately and correlated to path loss slope values.
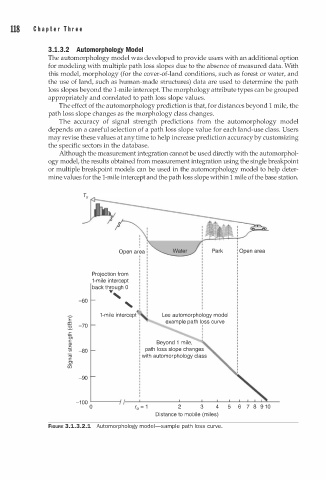
The effect of the automorphology prediction is that, for distances beyond 1 mile, the
path loss slope changes as the morphology class changes.
The accuracy of signal strength predictions from the automorphology model
depends on a careful selection of a path loss slope value for each land-use class. Users
may revise these values at any time to help increase prediction accuracy by customizing
the specific sectors in the database.
Although the measurement integration cannot be used directly with the automorphol
ogy model, the results obtained from measurement integration using the single breakpoint
or multiple breakpoint models can be used in the automorphology model to help deter
mine values for the 1-mile intercept and the path loss slope within 1 mile of the base station.
Open area
Projection from
1-mile intercept
back through 0
-60 ... ,
'
1-mile intercept , Lee automorphology model
E example path loss curve
l:tl -70 '
� ' '
.<:: '
0, '
c Beyond 1 mile,
Ui -80 path loss slope changes
�
Cii with automorphology class
c
C)
Ui
-90
-100 0 5 6 7 8 1 0
9
3
2
4
Distance to mobile (miles)
FIGURE 3.1.3.2.1 Automorphology model-sample path loss curve.