
Page 141 - Integrated Wireless Propagation Models
P. 141
I
M a c r o c e I P r e d i c t i o n M o d e I s - P a r t 2 : P o i n t - t o - P o i n t M o d e I s 119
3 . 1 . 4 Effects of Terrain Elevation on the Signal Strength Prediction
The calculation of two of the Lee model components-that is, the effective antenna
height gain and the diffraction loss-is affected by the local terrain elevation. Terrain
elevation data are extracted from the terrain files and used to create a terrain contour
profile of each radial, which support s the signal strength prediction of a sector with the
terrain contour profile of the radial array.
The model can also consider the effects of terrain averaging and the effective earth
curvature when determining terrain elevations in use. Terrain elevation data can also be
used for support when an optional water enhancement affects the signal strength calcu
lation in the Lee model variations.
The Lee model can use different terrain elevation data, terrain averaging, and effec
tive earth curvature in dealing with a complicated mobile environment.
3 . 1 . 4. 1 Terrain Elevation Data
10 11
Terrain elevation data • are stored and divided into a grid of data points spaced at
3-arc-second intervals. The average of all the data points in one grid is stored in that
grid. When a final file of all the grids is completed, the Lee model extracts the average
terrain elevations from the files to calculate the signal strength prediction.
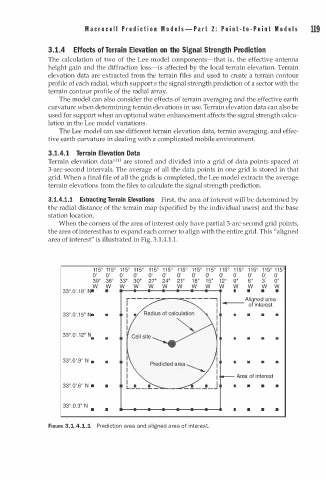
3.1.4. 1 . 1 Extracting Terrain Elevations First, the area of interest will be determined by
the radial distance of the terrain map (specified by the individual users) and the base
station location.
When the corners of the area of interest only have partial 3-arc-second grid points,
the area of interest has to expand each corner to align with the entire grid. This "aligned
area of interest" is illustrated in Fig. 3.1.4 1 . 1 .
.
1 1 5 ° 1 1 5 ° 1 1 5 ° 1 1 5 ° 1 1 5 ° 1 1 5 ° 1 1 5 ° 1 1 5 ° 1 1 5 ° 1 1 5 ° 1 1 5 ° 1 1 5 ° 1 1 5 ° 1 1 5
0' 0' 0' 0' 0' 0' 0' 0' 0' 0' 0' 0' 0' 0'
39" 36" 33" 30" 27" 24" 21 " 1 8 " 1 5 " 12" 9" 6" 3 " 0"
w w w w w w w w w w w w w w
33°.0'.1 8 " � • -- �--�----- - - - -+-...... ----. I • • •
Aligned area
of interest
33°.0'.1 5 " """ • • • •
'
33°.0 . 1 2 " N
• • • • •
33°.0'.9" N • • • • •
Area of interest
33°.0'.6" N • • • • •
• • I • • •
FIGURE 3.1.4.1.1 Prediction a rea and a ligned a rea of in terest.