
Page 142 - Integrated Wireless Propagation Models
P. 142
120 C h a p t e r T h r e e
When the aligned area of interest has been determined, the Lee model creates a list
of terrain contour (elevation profile) files covering this area. The elevation data needed
for the signal strength prediction are extracted from this list of files and formed in radial
arrays before being stored in memory.
3.1.4.1.2 Terrain Radials and Radial Arrays A terrain radial represents a signal path
from the base station to the mobile, and a radial array represents the points along the
radial at which the signal strength is predicted.
The number of radial arrays extracted from the terrain elevation data depends on
the number of radials specified by the user. The number of points contained in each
radial array is determined by the radial distance of the prediction divided by the radial
increment unit (equidistant spacing of points along the radial).
In creating the terrain radial, the Lee model uses three methods for choosing the
elevation values for radial points, as follows:
1. When a local point is located at a 3-arc-second grid, the elevation of that grid is
used.
2. When a local point is located between two 3-arc-second grids, the Lee model
takes the average elevation from the two grids along either a latitude or a
longitude line.
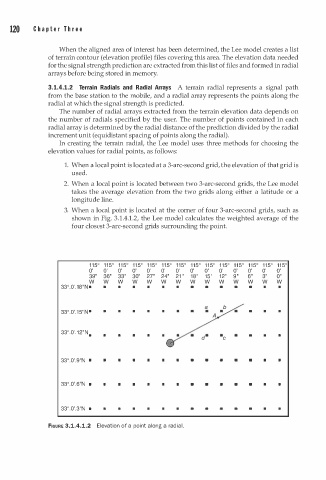
3. When a local point is located at the corner of four 3-arc-second grids, such as
shown in Fig. 3.1.4.1.2, the Lee model calculates the weighted average of the
four closest 3-arc-second grids surrounding the point.
1 1 5 ° 1 1 5 ° 1 1 5 ° 1 1 5 ° 1 1 5 ° 1 1 5 ° 1 1 5 ° 1 1 5 ° 1 1 5 ° 1 1 5 ° 1 1 5 ° 1 1 5 ° 1 1 5 ° 1 1 5 °
0' 0' 0' 0' 0' 0' 0' 0' 0' 0' 0' 0' 0' 0'
39" 36" 33" 30" 27" 24" 21 " 1 8 " 15" 12" 9" 6" 3" 0"
w w w w w w w w w w w w w w
33°.0'.18"N • • • • • • • • • • • • • •
33°.0'.1 5 " N • • • • • • • • •
.
33°.0' 1 2 " N
• • • • • • • • •
33°.0'.9"N • • • • • • • • • • • • • •
33°.0'.6"N • • • • • • • • • • • • • •
33°.0'.3"N • • • • • • • • • • • • • •
a
FIGURE 3.1.4.1.2 Elevation of a point l ong a radial.