
Page 139 - Integrated Wireless Propagation Models
P. 139
M a c r o c e I P r e d i c t i o n M o d e I s - P a r t 2 : P o i n t - t o - P o i n t M o d e I s 117
I
-20 -
-30 -
-40 -
-50 -
Lee single breakpoint model
E path loss reference
((} -60 - curve ("suburban")
:s
.r:
0,
c -70
�
tJ
Cii
c
Ol -80
(75
Lee multiple breakpoint
-90 model example path
loss curve
-100
-11 0
-12 Q LL __ __ __ __ __ __ __ __ __ L__L __ __ __ i_ __ i__L � _L� �
0 dt r0 = 1 2 3 4 5 6 7 8 1 0
9
Distance to mobile (miles)
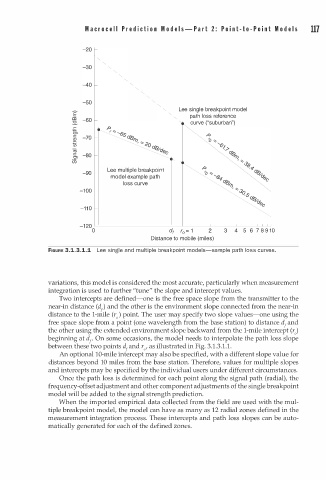
FIGURE 3.1.3.1.1 Lee single and multiple breakpoint models-sample path loss curves.
variations, this model is considered the most accurate, particularly when measurement
integration is used to further "tune" the slope and intercept values.
Two intercepts are defined-one is the free space slope from the transmitter to the
near-in distance (d ) and the other is the environment slope connected from the near-in
1
distance to the 1-mile (r0 ) point. The user may specify two slope values-one using the
free space slope from a point (one wavelength from the base station) to distance d and
1
the other using the extended environment slope backward from the 1-mile intercept (r)
beginning at d On some occasions, the model needs to interpolate the path loss slope
r
between these two points d and r0, as illustrated in Fig. 3.1.3 1 . 1 .
.
1
An optional 10-mile intercept may also e specified, with a different slope value for
b
distances beyond 10 miles from the base station. Therefore, values for multiple slopes
and intercepts may be specified by the individual users under different circumstances.
Once the path loss is determined for each point along the signal path (radial), the
frequency-offset adjustment and other component adjustments of the single breakpoint
model will be added to the signal strength prediction.
When the imported empirical data collected from the field are used with the mul
tiple breakpoint model, the model can have as many as 12 radial zones defined in the
measurement integration process. These intercepts and path loss slopes can be auto
matically generated for each of the defined zones.