
Page 171 - Integrated Wireless Propagation Models
P. 171
t
I
M a c r o c e I P r e d i c t i o n M o d e I - s P a r t 2 : P o i n - t o - P o i n t M o d e I s 149
The nominal value for y is from 2 to 4 and for o is usually 8 dB. Only the effect of flat
fading is considered. The coverage, C I I plots, and statistical charts based on the results
from simulation can be generated. Detailed information for each mobile unit and cell
site from different layouts and distributions are also supported through all text files.
This simulation is handling an ideal two-tier layout for K = 3 and 4; a three-tier
layout for K = 7; and four-tier layout for K = 12. All mobiles have assumed the same ERP
if the power control is absent or otherwise have caused the same received power at the
base station. The transmission from the mobile antenna is assumed to be omnidirec
tional. Each cell or sector uses the same antenna for both transmission and reception.
The interference from the higher tiers of co-channel cells is compared with the first tier
of co-channel cells to show that the interference from the higher tiers can be negligible
for the sake of analysis.
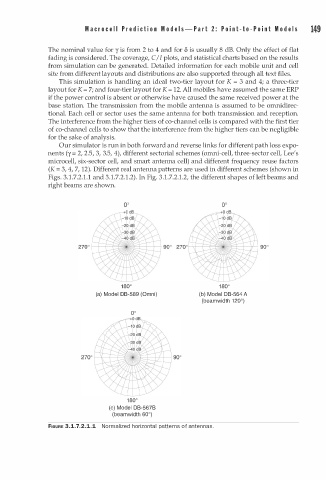
Our simulator is run in both forward and reverse links for different path loss expo
nents (y = 2, 2.5, 3, 3.5, 4), different sectorial schemes (ornni-cell, three-sector cell, Lee's
microcell, six-sector cell, and smart antenna cell) and different frequency reuse factors
(K = 3, 4, 7, 12). Different real antenna patterns are used in different schemes (shown in
Figs. 3.1.7.2. . 1 and 3.1.7.2.1.2). In Fig. 3.1.7.2.1.2, the different shapes of left beams and
1
right beams are shown.
180° 1 8 0°
(a) Model DB-589 (Omni) (b) Model DB-564 A
(beamwidth 2 0°)
1
oo
1 8 0°
(c) Model DB-567B
(beamwidth 60°)
FIGURE 3.1.7.2.1.1 Normalized horizontal patterns of antennas.