
Page 175 - Integrated Wireless Propagation Models
P. 175
M a c r o c e l l P r e d i c t i o n M o d e l s - P a r t 2 : P o i n t - t o - P o i n t M o d e l s 153
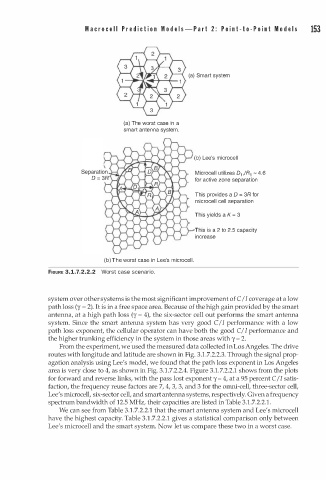
(a) Smart system
(a) The worst case in a
smart antenna system.
(b) Lee's microcell
Microcell utilizes 01 ,/R1 � 4.6
for active zone separation
This provides a 0 = 3R for
microcell cell separation
This yields a K 3
=
This is a 2 to 2.5 capacity
increase
(b) The worst case in Lee's microcell.
FIGURE 3.1.7.2.2.2 Worst case scenario.
system over other systems is the most significant improvement of C/I coverage at a low
path loss (y = 2). It is in a free space area. Because of the high gain provided by the smart
antenna, at a high path loss (y = 4), the six-sector cell out performs the smart antenna
system. Since the smart antenna system has very good C/I performance with a low
path loss exponent, the cellular operator can have both the good C/ I performance and
the higher trunking efficiency in the system in those areas with y = 2.
From the experiment, we used the measured data collected in Los Angeles. The drive
routes with longitude and latitude are shown in Fig. 3.1.7.2.2.3. Through the signal prop
agation analysis using Lee's model, we found that the path loss exponent in Los Angeles
area is very close to 4, as shown in Fig. 3.1.7.2.2.4. Figure 3.1.7.2.2.1 shows from the plots
for forward and reverse links, with the pass lost exponent y = 4, at a 95 percent C I I satis
faction, the frequency reuse factors are 7, 4, 3, 3, and 3 for the ornni-cell, three-sector cell,
Lee's microcell, six-sector cell, and smart antenna systems, respectively. Given a frequency
1
spectrum bandwidth of 12.5 MHz, their capacities are listed in Table 3.1.7.2.2. .
We can see from Table 3.1.7.2.2.1 that the smart antenna system and Lee's microcell
have the highest capacity. Table 3.1.7.2.2.1 gives a statistical comparison only between
Lee's microcell and the smart system. Now let us compare these two in a worst case.