
Page 172 - Integrated Wireless Propagation Models
P. 172
150 C h a p t e r T h r e e
1 8 0° 1 8 0°
1
1
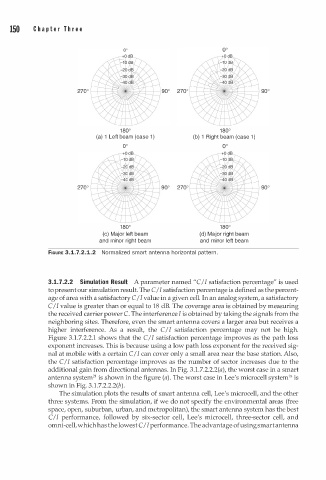
(a) 1 Left beam (case ) (b) 1 Right beam (case )
oo
1 8 0° 1 8 0°
(c) Major left beam (d) Major right beam
and minor right beam and minor left beam
FIGURE 3.1.7.2.1.2 Normalized smart antenna horizontal pattern.
3.1.7.2.2 Simulation Result A parameter named "C/I satisfaction percentage" is used
to present our simulation result. The C/ I satisfaction percentage is defined as the percent
age of area with a satisfactory C/Ivalue in a given cell. In an analog system, a satisfactory
C I I value is greater than or equal to 18 dB. The coverage area is obtained by measuring
the received carrier power C. The interference I is obtained by taking the signals from the
neighboring sites. Therefore, even the smart antenna covers a larger area but receives a
higher interference. As a result, the C/I satisfaction percentage may not be high.
Figure 3.1.7.2.2.1 shows that the C!I satisfaction percentage improves as the path loss
exponent increases. This is because using a low path loss exponent for the received sig
nal at mobile with a certain C/I can cover only a small area near the base station. Also,
the C/I satisfaction percentage improves as the number of sector increases due to the
additional gain from directional antennas. In Fig. 3.1.7.2.2.2(a), the worst case in a smart
1
1
antenna system2 is shown in the figure (a). The worst case in Lee's microcell system 8 is
shown in Fig. 3.1.7.2.2.2(b).
The simulation plots the results of smart antenna cell, Lee's microcell, and the other
three systems. From the simulation, if we do not specify the environmental areas (free
space, open, suburban, urban, and metropolitan), the smart antenna system has the best
C/I performance, followed by six-sector cell, Lee's microcell, three-sector cell, and
ornni-cell, which has the lowest C/ I performance. The advantage of using smart antenna