
Page 177 - Integrated Wireless Propagation Models
P. 177
M a c r o c e l l P r e d i c t i o n M o d e l s - P a r t 2 : P o i n t - t o - P o i n t M o d e l s 155
0.4
0.35 · · · · · · Micro
. 0.8
0.3 -- s mart
0.25 : :
: : 0.6
'5 0.2 : '5
a. u
0.15 0.4
0.1 0.2 · · · · · · Micro
0.05 -- s mart
o ��-+��+*������ 0
0 3 6 9 12 15 18 21 24 27 30 33 3638 42 45 0 10 20 30 40 50
C/1 (db) C// (db)
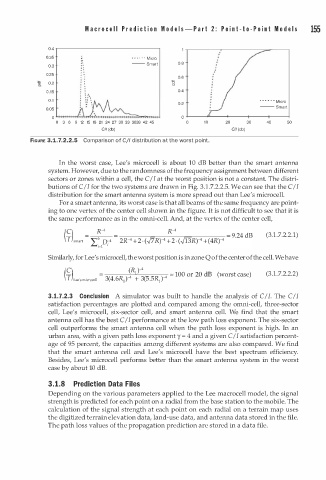
FtGURE 3.1.7.2.2.5 Comparison of C/1 distribution at the worst point.
In the worst case, Lee's microcell is about 10 dB better than the smart antenna
system. However, due to the randomness of the frequency assignment between different
sectors or zones within a cell, the C/I at the worst position is not a constant. The distri
butions of C!I for the two systems are drawn in Fig. 3.1.7.2.2.5. We can see that the C/I
distribution for the smart antenna system is more spread out than Lee's microcell.
For a smart antenna, its worst case is that all beams of the same frequency are point
ing to one vertex of the center cell shown in the figure. It is not difficult to see that it is
the same performance as in the omni-cell. And, at the vertex of the center cell,
(3. . 7.2.2.1)
1
Similarly, for Lee's microcell, the worst position is in zone Q of the center of the cell. We have
(c) (R ) -4 _
l
_
. . - 3(4 bR ) -4 + - 100 or 20 dB (worst case) (3.1.7.2.2.2)
1
·
T Lee s nucrocell • 1 3(5 5R ) -4
3 . 1 .7.2.3 Conclusion A simulator was built to handle the analysis of C/I. The C/I
satisfaction percentages are plotted and compared among the omni-cell, three-sector
cell, Lee's microcell, six-sector cell, and smart antenna cell. We find that the smart
antenna cell has the best C I I performance at the low path loss exponent. The six-sector
cell outperforms the smart antenna cell when the path loss exponent is high. In an
urban area, with a given path loss exponent y = 4 and a given C/I satisfaction percent
age of 95 percent, the capacities among different systems are also compared. We find
that the smart antenna cell and Lee's microcell have the best spectrum efficiency.
Besides, Lee's microcell performs better than the smart antenna system in the worst
case by about 10 dB.
3 . 1 . 8 Prediction Data Files
Depending on the various parameters applied to the Lee macrocell model, the signal
strength is predicted for each point on a radial from the base station to the mobile. The
calculation of the signal strength at each point on each radial on a terrain map uses
the digitized terrain elevation data, land-use data, and antenna data stored in the file.
The path loss values of the propagation prediction are stored in a data file.