
Page 182 - Integrated Wireless Propagation Models
P. 182
160 C h a p t e r T h r e e
2800 ,-----,------,-----,------,-----,------,-----,------,-----,
2600 � -- -- + - -- -- - r -- -- � -- -- -- r - -- -- + - -- -- � �- � -- -- � -- -- -- + - -- �
l
l. ,:-��l-r.''i· --� -- -- --+--------j
"-
2400 � ---- � ---- � ------ + ------ + ------� ��---- � ----�----�
22oo ��/1·--
� �:: J
0 � -- -- � -- -- � -- -- -- + --- -- -+ -- -- -- h;.� � -.-- -- r --- -- -+ -- -- ---1
� 1 6 00 ·,.r ; .l
> . ;y/ . _:; .. ;._' -- -- +--- -- -+ -- -- ------1
(]) 1 4 00 .. . _ . ..
... � ·< " " '-'• "'! ' " .:.: ''· - ---- -- -- + - - c :"i' +- -- -- -+ -- -- ------1 -- -- -----1
w 1 2 00 __ _•·
,.'..
. ..... ··
1 0 .00
Distance (miles)
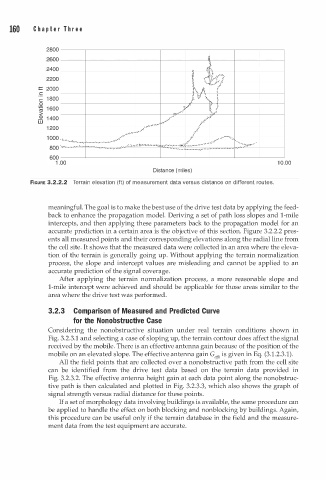
FIGURE 3.2.2.2 Terrain elevation (ft) of measurement data versus distance on different routes.
meaningful. The goal is to make the best use of the drive test data by applying the feed
back to enhance the propagation model. Deriving a set of path loss slopes and 1--mile
intercepts, and then applying these parameters back to the propagation model for an
accurate prediction in a certain area is the objective of this section. Figure 3.2.2.2 pres
ents all measured points and their corresponding elevations along the radial line from
the cell site. It shows that the measured data were collected in an area where the eleva
tion of the terrain is generally going up. Without applying the terrain normalization
process, the slope and intercept values are misleading and cannot be applied to an
accurate prediction of the signal coverage.
After applying the terrain normalization process, a more reasonable slope and
1--mile intercept were achieved and should be applicable for those areas similar to the
area where the drive test was performed.
3.2.3 Comparison of Measured and Predicted Curve
for the Nonobstructive Case
Considering the nonobstructive situation under real terrain conditions shown in
Fig. 3.2.3.1 and selecting a case of sloping up, the terrain contour does affect the signal
received by the mobile. There is an effective antenna gain because of the position of the
mobile on an elevated slope. The effective antenna gain G,ff" is given in Eq. (3.1.2.3.1).
All the field points that are collected over a nonobstructive path from the cell site
can be identified from the drive test data based on the terrain data provided in
Fig. 3.2.3.2. The effective antenna height gain at each data point along the nonobstruc
tive path is then calculated and plotted in Fig. 3.2.3.3, which also shows the graph of
signal strength versus radial distance for these points.
If a set of morphology data involving buildings is available, the same procedure can
be applied to handle the effect on both blocking and nonblocking by buildings. Again,
this procedure can be useful only if the terrain database in the field and the measure
ment data from the test equipment are accurate.