
Page 292 - Introduction to Autonomous Mobile Robots
P. 292
Planning and Navigation
P 277
threshold
α
-180° 0 180°
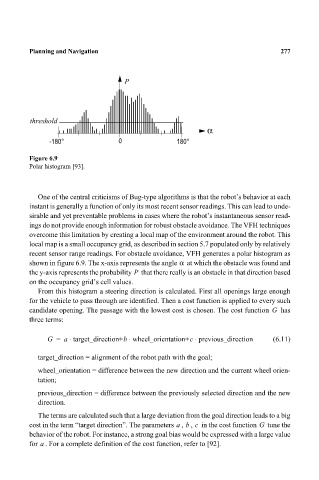
Figure 6.9
Polar histogram [93].
One of the central criticisms of Bug-type algorithms is that the robot’s behavior at each
instant is generally a function of only its most recent sensor readings. This can lead to unde-
sirable and yet preventable problems in cases where the robot’s instantaneous sensor read-
ings do not provide enough information for robust obstacle avoidance. The VFH techniques
overcome this limitation by creating a local map of the environment around the robot. This
local map is a small occupancy grid, as described in section 5.7 populated only by relatively
recent sensor range readings. For obstacle avoidance, VFH generates a polar histogram as
α
shown in figure 6.9. The x-axis represents the angle at which the obstacle was found and
the y-axis represents the probability that there really is an obstacle in that direction based
P
on the occupancy grid’s cell values.
From this histogram a steering direction is calculated. First all openings large enough
for the vehicle to pass through are identified. Then a cost function is applied to every such
candidate opening. The passage with the lowest cost is chosen. The cost function G has
three terms:
⋅
⋅
⋅
G = a target_direction+b wheel_orientation+c previous_direction (6.11)
target_direction = alignment of the robot path with the goal;
wheel_orientation = difference between the new direction and the current wheel orien-
tation;
previous_direction = difference between the previously selected direction and the new
direction.
The terms are calculated such that a large deviation from the goal direction leads to a big
abc
cost in the term “target direction”. The parameters , , in the cost function G tune the
behavior of the robot. For instance, a strong goal bias would be expressed with a large value
for . For a complete definition of the cost function, refer to [92].
a