Page 119 - Introduction to Computational Fluid Dynamics
P. 119

P1: IWV
                                                                                                11:7
                                                                                   May 25, 2005
                           CB908/Date
            0521853265c04
                     98
                             1.2        0 521 85326 5                          2D BOUNDARY LAYERS
                                                   Solid Line - With Reaction 1
                                  H O = 0.001
                                    2
                             1.0                 Dashed Line - Without Reaction 1
                                  Sc = 0.51
                                  P = 0.72            BRR (PRED)
                                    r
                             0.8
                             0.6
                                                                             BRR (EXPT)
                             0.4    O 2
                                                          CO 2
                             0.2                                                  CO


                             0.0


                            −0.2
                               800         1000        1200        1400         1600        1800
                                                                          Tw
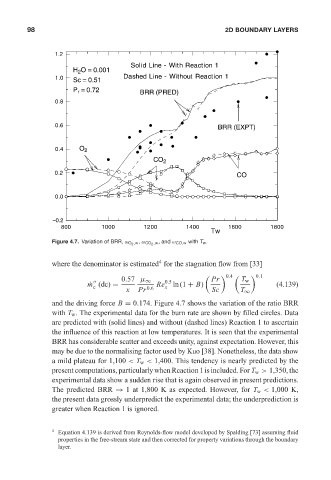
                            Figure 4.7. Variation of BRR, ω O 2 ,w , ω CO 2 ,w , and ω CO,w with T w .


                                                           4
                            where the denominator is estimated for the stagnation flow from [33]
                                                                               0.4      0.1
                                                                            Pr
                                                0.57 µ ∞     0.5                   T w
                                       ˙ m (dc) =          Re  ln(1 + B)                      (4.139)
                                        c               0.6  x
                                                  x  Pr                    Sc      T ∞
                            and the driving force B = 0.174. Figure 4.7 shows the variation of the ratio BRR
                            with T w . The experimental data for the burn rate are shown by filled circles. Data
                            are predicted with (solid lines) and without (dashed lines) Reaction 1 to ascertain
                            the influence of this reaction at low temperatures. It is seen that the experimental
                            BRR has considerable scatter and exceeds unity, against expectation. However, this
                            may be due to the normalising factor used by Kuo [38]. Nonetheless, the data show
                            a mild plateau for 1,100 < T w < 1,400. This tendency is nearly predicted by the
                            present computations, particularly when Reaction 1 is included. For T w > 1,350, the
                            experimental data show a sudden rise that is again observed in present predictions.
                            The predicted BRR → 1 at 1,800 K as expected. However, for T w < 1,000 K,
                            the present data grossly underpredict the experimental data; the underprediction is
                            greater when Reaction 1 is ignored.


                            4  Equation 4.139 is derived from Reynolds-flow model developed by Spalding [73] assuming fluid
                              properties in the free-stream state and then corrected for property variations through the boundary
                              layer.
   114   115   116   117   118   119   120   121   122   123   124