
Page 131 - Introduction to Mineral Exploration
P. 131
114 M.K.G. WHATELEY
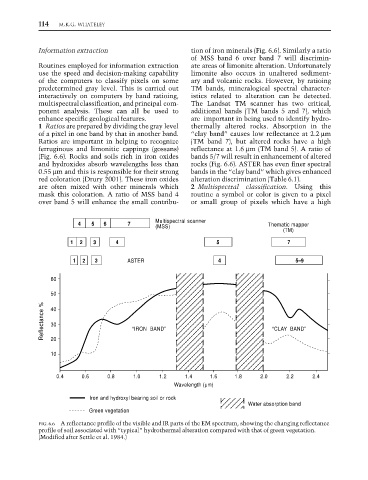
Information extraction tion of iron minerals (Fig. 6.6). Similarly a ratio
of MSS band 6 over band 7 will discrimin-
Routines employed for information extraction ate areas of limonite alteration. Unfortunately
use the speed and decision-making capability limonite also occurs in unaltered sediment-
of the computers to classify pixels on some ary and volcanic rocks. However, by ratioing
predetermined gray level. This is carried out TM bands, mineralogical spectral character-
interactively on computers by band ratioing, istics related to alteration can be detected.
multispectral classification, and principal com- The Landsat TM scanner has two critical,
ponent analysis. These can all be used to additional bands (TM bands 5 and 7), which
enhance specific geological features. are important in being used to identify hydro-
1 Ratios are prepared by dividing the gray level thermally altered rocks. Absorption in the
of a pixel in one band by that in another band. “clay band” causes low reflectance at 2.2 µm
Ratios are important in helping to recognize (TM band 7), but altered rocks have a high
ferruginous and limonitic cappings (gossans) reflectance at 1.6 µm (TM band 5). A ratio of
(Fig. 6.6). Rocks and soils rich in iron oxides bands 5/7 will result in enhancement of altered
and hydroxides absorb wavelengths less than rocks (Fig. 6.6). ASTER has even finer spectral
0.55 µm and this is responsible for their strong bands in the “clay band” which gives enhanced
red coloration (Drury 2001). These iron oxides alteration discrimination (Table 6.1).
are often mixed with other minerals which 2 Multispectral classification. Using this
mask this coloration. A ratio of MSS band 4 routine a symbol or color is given to a pixel
over band 5 will enhance the small contribu- or small group of pixels which have a high
Multispectral scanner
4 5 6 7 Thematic mapper
(MSS)
(TM)
1 2 3 4 5 7
1 2 3 ASTER 4 5–9
60
50
Reflectance % 40 “IRON BAND” “CLAY BAND”
30
20
10
0.4 0.6 0.8 1.0 1.2 1.4 1.6 1.8 2.0 2.2 2.4
Wavelength (mm)
Iron and hydroxyl bearing soil or rock
Water absorption band
Green vegetation
FIG. 6.6 A reflectance profile of the visible and IR parts of the EM spectrum, showing the changing reflectance
profile of soil associated with “typical” hydrothermal alteration compared with that of green vegetation.
(Modified after Settle et al. 1984.)