
Page 128 - Introduction to Mineral Exploration
P. 128
6: REMOTE SENSING 111
(a)
Reflectance %
0 255
Transformed gray level
(b)
Transformed gray level Reflectance %
Input gray level 0 30 170 255
Transformed gray level
Transformed gray level (c) Reflectance %
30 170 0 255
Input gray level Transformed gray level
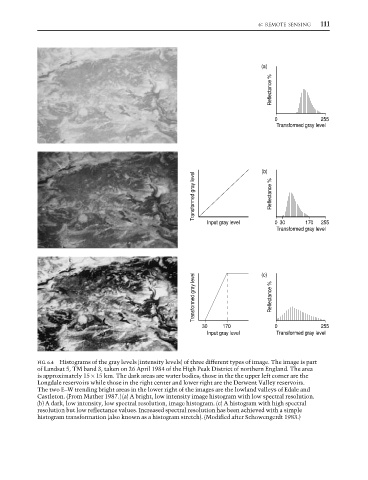
FIG. 6.4 Histograms of the gray levels (intensity levels) of three different types of image. The image is part
of Landsat 5, TM band 3, taken on 26 April 1984 of the High Peak District of northern England. The area
is approximately 15 × 15 km. The dark areas are water bodies; those in the the upper left corner are the
Longdale reservoirs while those in the right center and lower right are the Derwent Valley reservoirs.
The two E–W trending bright areas in the lower right of the images are the lowland valleys of Edale and
Castleton. (From Mather 1987.) (a) A bright, low intensity image histogram with low spectral resolution.
(b) A dark, low intensity, low spectral resolution, image histogram. (c) A histogram with high spectral
resolution but low reflectance values. Increased spectral resolution has been achieved with a simple
histogram transformation (also known as a histogram stretch). (Modified after Schowengerdt 1983.)