
Page 124 - Introduction to Mineral Exploration
P. 124
6: REMOTE SENSING 107
Data storage
TDRS
6 Detectors per band
SCANNER OPTICS
4 GR Oscillating
5 RED scan mirror
6 IR
7 IR
918 km Altitude Field of view = 11.56°
Ground
185 km receiving
station
Active 185 km
scan
North
6 Lines/scan/band
West East Path of
spacecraft travel
South
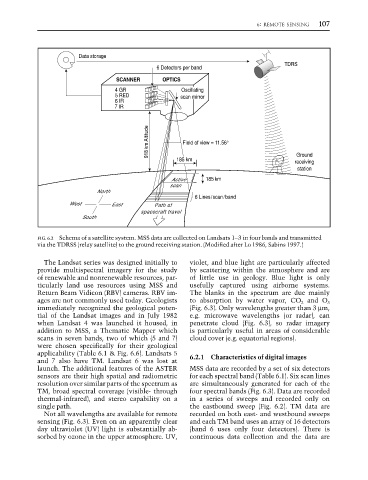
FIG. 6.2 Schema of a satellite system. MSS data are collected on Landsats 1–3 in four bands and transmitted
via the TDRSS (relay satellite) to the ground receiving station. (Modified after Lo 1986, Sabins 1997.)
The Landsat series was designed initially to violet, and blue light are particularly affected
provide multispectral imagery for the study by scattering within the atmosphere and are
of renewable and nonrenewable resources, par- of little use in geology. Blue light is only
ticularly land use resources using MSS and usefully captured using airborne systems.
Return Beam Vidicon (RBV) cameras. RBV im- The blanks in the spectrum are due mainly
ages are not commonly used today. Geologists to absorption by water vapor, CO 2 and O 3
immediately recognized the geological poten- (Fig. 6.3). Only wavelengths greater than 3 µm,
tial of the Landsat images and in July 1982 e.g. microwave wavelengths (or radar), can
when Landsat 4 was launched it housed, in penetrate cloud (Fig. 6.3), so radar imagery
addition to MSS, a Thematic Mapper which is particularly useful in areas of considerable
scans in seven bands, two of which (5 and 7) cloud cover (e.g. equatorial regions).
were chosen specifically for their geological
applicability (Table 6.1 & Fig. 6.6). Landsats 5
and 7 also have TM. Landsat 6 was lost at 6.2.1 Characteristics of digital images
launch. The additional features of the ASTER MSS data are recorded by a set of six detectors
sensors are their high spatial and radiometric for each spectral band (Table 6.1). Six scan lines
resolution over similar parts of the spectrum as are simultaneously generated for each of the
TM, broad spectral coverage (visible- through four spectral bands (Fig. 6.3). Data are recorded
thermal-infrared), and stereo capability on a in a series of sweeps and recorded only on
single path. the eastbound sweep (Fig. 6.2). TM data are
Not all wavelengths are available for remote recorded on both east- and westbound sweeps
sensing (Fig. 6.3). Even on an apparently clear and each TM band uses an array of 16 detectors
day ultraviolet (UV) light is substantially ab- (band 6 uses only four detectors). There is
sorbed by ozone in the upper atmosphere. UV, continuous data collection and the data are