
Page 123 - Introduction to Mineral Exploration
P. 123
106 M.K.G. WHATELEY
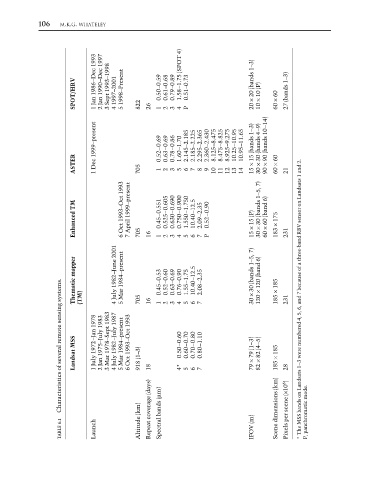
SPOT/HRV 1 Jan 1986–Dec 1993 2 Jan 1990–Dec 1997 3 Sept 1993–1998 4 1997–2001 5 1998–Present 822 26 0.50–0.59 1 0.61–0.68 2 0.79–0.89 3 1.58–1.75 (SPOT 4) 4 0.51–0.73 P 20 (bands 1–3) × 20 10 (P) × 10 60 × 60 27 (bands 1–3)
1 Dec 1999–present 0.52–0.69 0.63–0.69 0.78–0.86 1.60–1.70 2.145–2.185 2.185–2.225 2.295–2.365 2.360–2.430 8.125–8.475 8.475–8.825 8.925–9.275 10.25–10.95 10.95–11.65 15 (bands 1–3) 30 (bands 4–9) 90 (bands 10–14)
ASTER 705 1 2 3 5 6 7 8 9 10 11 12 13 14 × 15 × 30 × 90 60 × 60 21
Enhanced TM 6 Oct 1993–Oct 1993 7 April 1999–present 705 16 0.45–0.551 1 0.525–0.605 2 0.630–0.690 3 0.750–0.900 4 1.550–1.750 5 10.40–12.5 6 2.09–2.35 7 0.52–0.90 P 15 (P) × 15 30 (bands 1–5, 7) × 30 60 (band 6) × 60 175 × 183 231
Thematic mapper (TM) 4 July 1982–June 2001 5 Mar 1984–present 705 16 0.45–0.53 1 0.52–0.60 2 0.63–0.69 3 0.76–0.90 4 1.55–1.75 5 10.40–12.5 6 2.08–2.35 7 30 (bands 1–5, 7) × 30 120 (band 6) × 120 185 × 185 231 * The MSS bands on Landsats 1–3 were numbered 4, 5, 6, and 7 because of a three-band RBV sensor on Landsats 1 and 2.
Characteristics of several remote sensing systems.
Landsat MSS 1 July 1972–Jan 1978 2 Jan 1975–July 1983 3 Mar 1978–Sept 1983 4 July 1982–July 1987 5 Mar 1984–present 6 Oct 1993–Oct 1993 918 (1–3) 18 0.50–0.60 4* 0.60–0.70 5 0.70–0.80 6 0.80–1.10 7 79 (1–3) × 79 82 (4–5) × 82 185 × 185 28
TABLE 6.1 Launch Altitude (km) Repeat coverage (days) Spectral bands (µm) IFOV (m) Scene dimensions (km) Pixels per scene (×10 6 ) P, panchromatic mode.