
Page 187 - Introduction to Mineral Exploration
P. 187
170 C.J. MOON
0.0 LH Organic
AE Sand/silt/clay
ppm
BF Sand/silt/clay
0.3
BM Sand/silt/clay m
0.6 BM Sand/silt/clay
C1 Sand
a
C2 Sand/silt
0.9
C1 Sand b
c
R
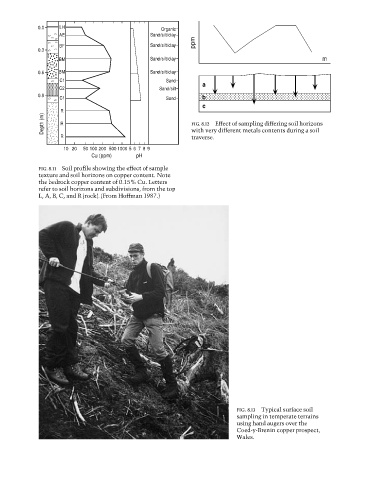
Depth (m) R FIG. 8.12 Effect of sampling differing soil horizons
with very different metals contents during a soil
R traverse.
10 20 50 100 200 500 1000 5 6 7 8 9
Cu (ppm) pH
FIG. 8.11 Soil profile showing the effect of sample
texture and soil horizons on copper content. Note
the bedrock copper content of 0.15% Cu. Letters
refer to soil horizons and subdivisions, from the top
L, A, B, C, and R (rock). (From Hoffman 1987.)
FIG. 8.13 Typical surface soil
sampling in temperate terrains
using hand augers over the
Coed-y-Brenin copper prospect,
Wales.