
Page 318 - System on Package_ Miniaturization of the Entire System
P. 318
292 Cha pte r F i v e
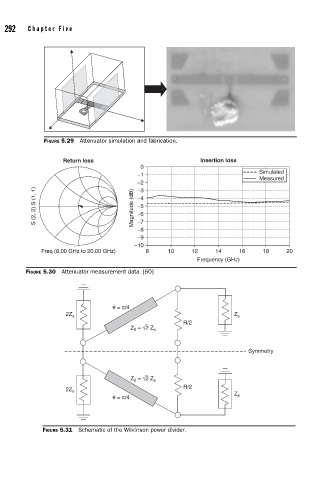
FIGURE 5.29 Attenuator simulation and fabrication.
Return loss Insertion loss
0
Simulated
ed
−1 Simulat
Measud
re
Measured
−2
S (2, 2) S (1, 1) Magnitude (dB) −4
−3
−5
−6
−7
−8
−9
−10
Freq (8.00 GHz to 20.00 GHz) 8 10 12 14 16 18 20
Frequency (GHz)
FIGURE 5.30 Attenuator measurement data. [60]
θ = π/4
2Z s Z s
R/2
Z = √2 Z s
0
Symmetry
Z = √2 Z s
0
R/2
2Z s
Z
θ = π/4 s
FIGURE 5.31 Schematic of the Wilkinson power divider.